by Michael Sklarz, Ph.D., Jim Follain Ph.D., and Norm Miller Ph.D
The Collateral Analytics Research & Development Group has been working on a new project over the past year which we feel is both ground breaking and exciting. The goal of this project is to develop a property condition rating for each home in the U.S.
To accomplish this, we started with our very robust and detailed Local Market data and used a number of components including the property condition data field (when available) coupled with text mining techniques which were developed to search for key words in the property remarks section for each listing. These were mapped to Fannie Mae’s standardized C1 to C6 property condition ratings for appraisals. This resulted in historical and current property condition ratings and respective dates for approximately 10 Million single family homes around the U.S.
There are obviously many ways which this information can be used. Our initial motivations for creating this novel data set included:
- Creating the next generation of our CA Value AVM which selects and uses comparable properties which indicate the nearest condition to the property being valued.
- Providing market-based factors for automatically making property condition adjustments for CA’s new iBPO and iAppraisal products.
- Helping our clients best determine the Return on Investment when making renovations on a home.
For example, helping to answer feasibility questions of whether a higher price will be achieved by moving a home from, say, a C5 to C3 condition and, at a minimum, cover the cost of the improvements? This could apply to a large lender selling a REO property as well as a real estate broker listing a home for sale.
The charts below show some of the initial results using this data.
Figure 1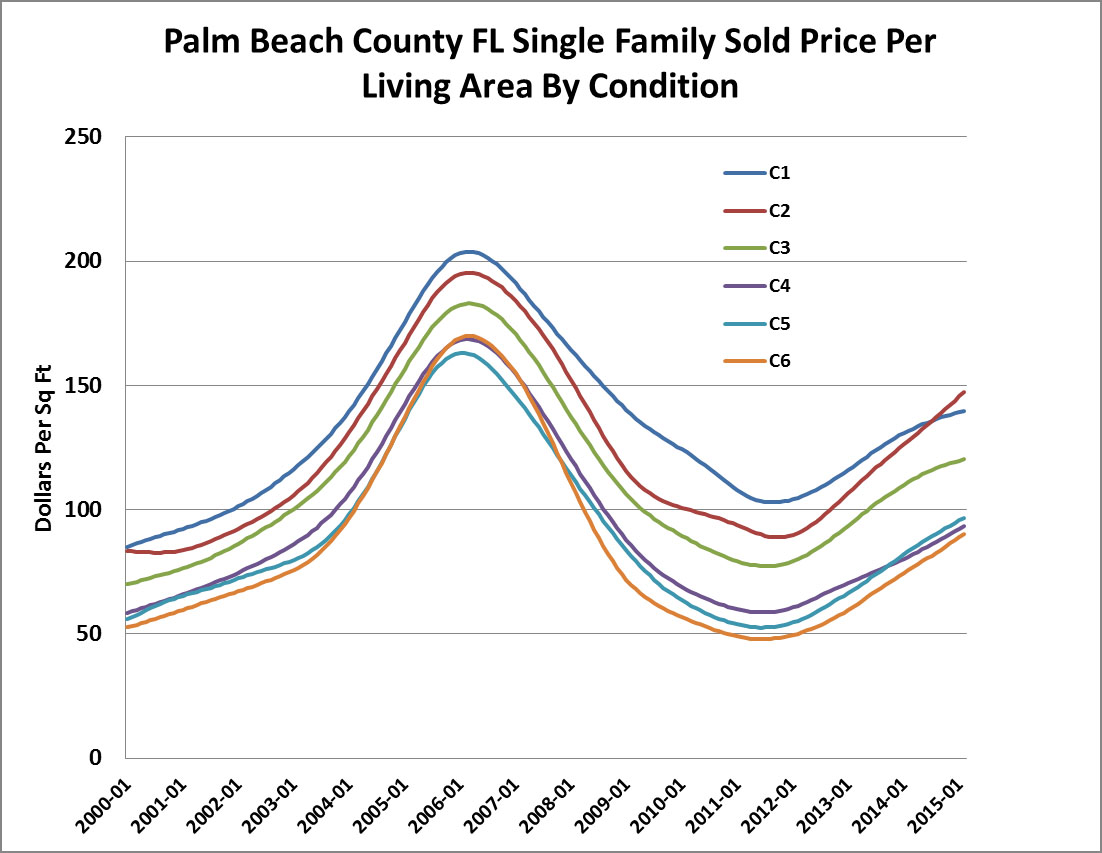
Figure 1 above, shows median single family prices on a per square foot of living area basis for Palm Beach FL County where each contour corresponds to one of the C1 to C6 property condition ratings. As illustrated, the various prices series line up very much as one would expect with the superior condition home indications being at the higher end of the price envelopes and the inferior condition homes at the lower end. Figure 2 below shows the same for Multnomah OR County.
Figure 2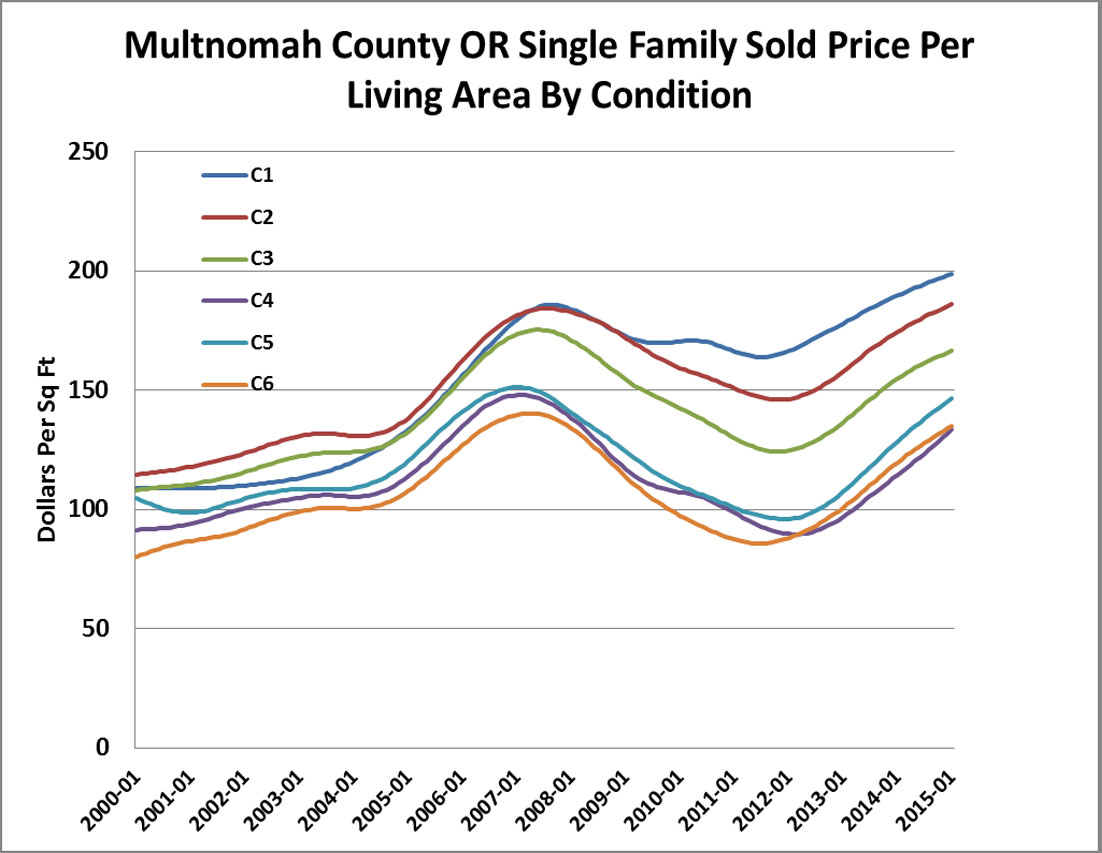
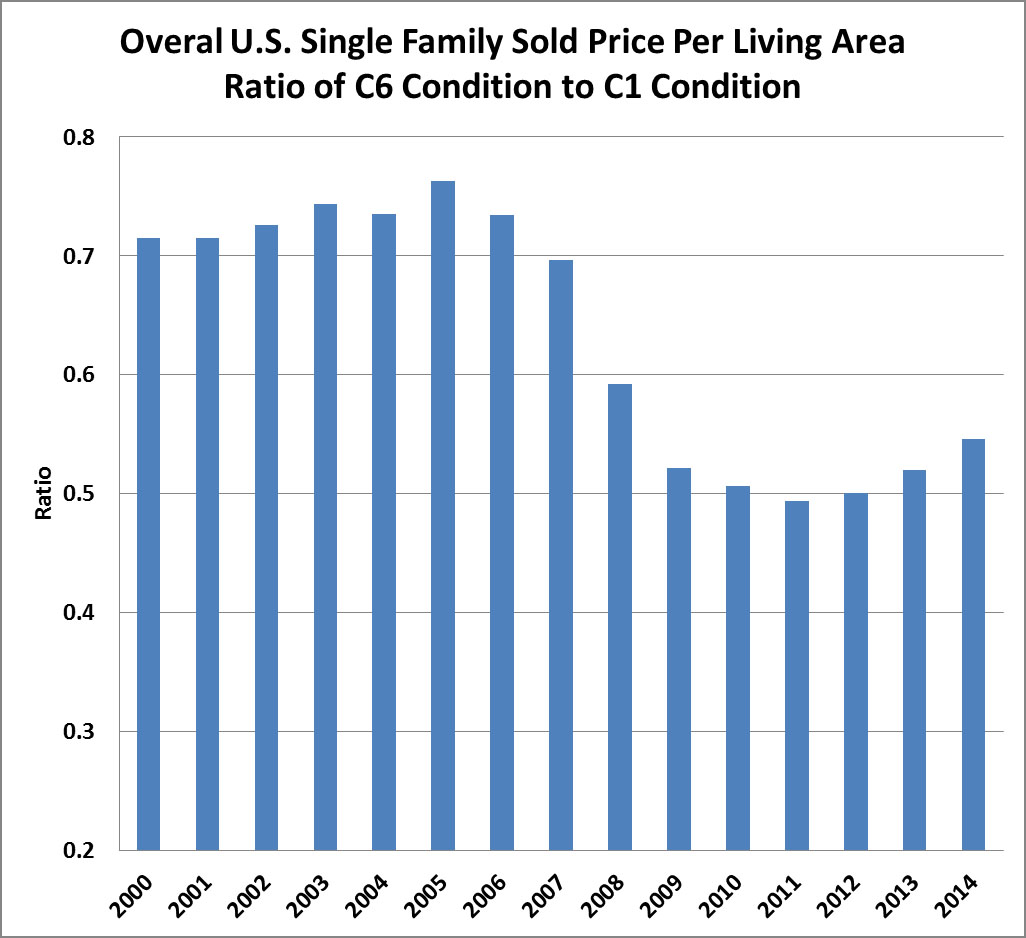
Another very interesting (and probably intuitive) result is that the price condition series were less dispersed or had lesser variance during the strong market environment of 2004-2006. For experienced real estate market participants, this makes sense since a typical buyer would likely be less resistant to property defects or deferred maintenance issues during market upswings, especially if there are multiple buyers bidding for the same home. One way of quantifying this difference is to track the ratio of the single family sold price per living area for C6 condition homes relative to C1 homes. As seen in Figure 3 below, this ratio was above 0.7 from 2000 to 2007 but has been closer to 0.5 since 2009.
Figure 3