by Dr. Michael Sklarz and Dr. Norman Miller | August 16, 2017
Download a PDF file of this research paper here.
Abstract
Here we examine the price differentials for homes sold through traditional agents through the multiple listing service compared to “For-Sale-By-Owner” sales for a variety of geographic markets with data from 2016-2017. In contrast to previous studies on this topic, we find that FSBOs tend to sell for lower prices than comparable home sales, and in many cases below the average differential represented by the prevailing commission rate. We improve upon prior studies by using an Automated Valuation Model or AVM to control for differences in property attributes.
Introduction
Real estate commissions at full service[1] brokers are a significant transaction cost and some homeowners try to avoid this cost by attempting to sell their own home. Prior empirical literature suggests that there is no significant price difference between a For Sale by Owner (“FSBO”) sale and a real estate agent Multiple Listing Service (MLS) marketed sale, although most suggest that MLS sales are quicker. What is not clear is the percentage of unsuccessful FSBO attempts, where no sale is achieved, and we are unable to answer that question here. As to the issue of a price differential, that is not an easy question to address, as there could be systematic differences between FSBO sales and MLS sales. If FSBO prices were as a group systematically lower in average price compared to MLS sales, one might get a spurious conclusion that similar property when sold by an owner sells for less. But in the data base used in this study, our average FSBO prices were actually higher. There could also be other systematic differences potentially affecting empirical results.
Sellers who choose to sell their own property might have different levels of urgency or motivation and need to sell. For example, sellers who are retired and have a lot of time with no urgency to sell could be more stubborn on price, making them less likely to sell but more likely to get a higher price if they do sell. Conversely, those sellers desiring a faster and higher probability of sale are more likely to list with real estate agents that use the MLS as the most dominant platform. Thus, low levels of seller urgency or motivation would would support a similar price, if not higher price, for FSBOs.
Systematic differences in property attributes could also give a false reading on the price effect resulting from the type of sales process used. For example, if FSBO sellers tended to sell lower (or higher) quality property than MLS sellers, it could create a spurious relationship and conclusion on price differentials caused by the selling process or channel. We have no reason to believe this is the case and do not try and control for quality aside from using age as an indication of property condition.
There could be systematic bias on the buyer side as well. FSBO sales might attract more strategic buyers than MLS sales, particularly buyers who rationalize lower-priced bids on with the logic that the seller is “saving” a traditional commission. Such buyers might specifically search for and target sellers who are not getting representational assistance from agents. Accordingly, we might expect FSBOs to sell at lower prices on average than MLS agent-driven sales.
Last, agent and broker services themselves may exert systematic positive influences on the sales price for MLS sales. Experienced agents are experts at “staging” homes for sale, for example, which may include removing excess furniture or personal items that clutter a home, adding new or better furniture, making sure the unit is well repaired and clean, showing the home when noise is minimal and adding in music, the smell of fresh baking, fireplaces in action, etc. Similarly, properties listed with a broker that is a member of the local MLS will be listed online with all other participating broker websites, marketing the home to a much larger buyer population. And those MLS properties generally offer compensation to agents who represent buyers, incentivizing them to show and sell the property and again potentially enlarging the buyer pool. Accordingly, if the average agent is better at staging a home for sale than a typical homeowner, or if listing with a broker enlarges the potential buyer population through marketing or agent incentives that would provide a systematically higher probability of sale and/or a higher price.
Here we attempt to improve upon past studies by expanding the number and scope of markets examined, and to do so with better controls on property differences by using a modern and well established automated valuation model (AVM) to control for differences in property attributes. Below these possible influences on prices paid are summarized.
Potential Influences on Prices Paid for FSBOs versus Regular Sales
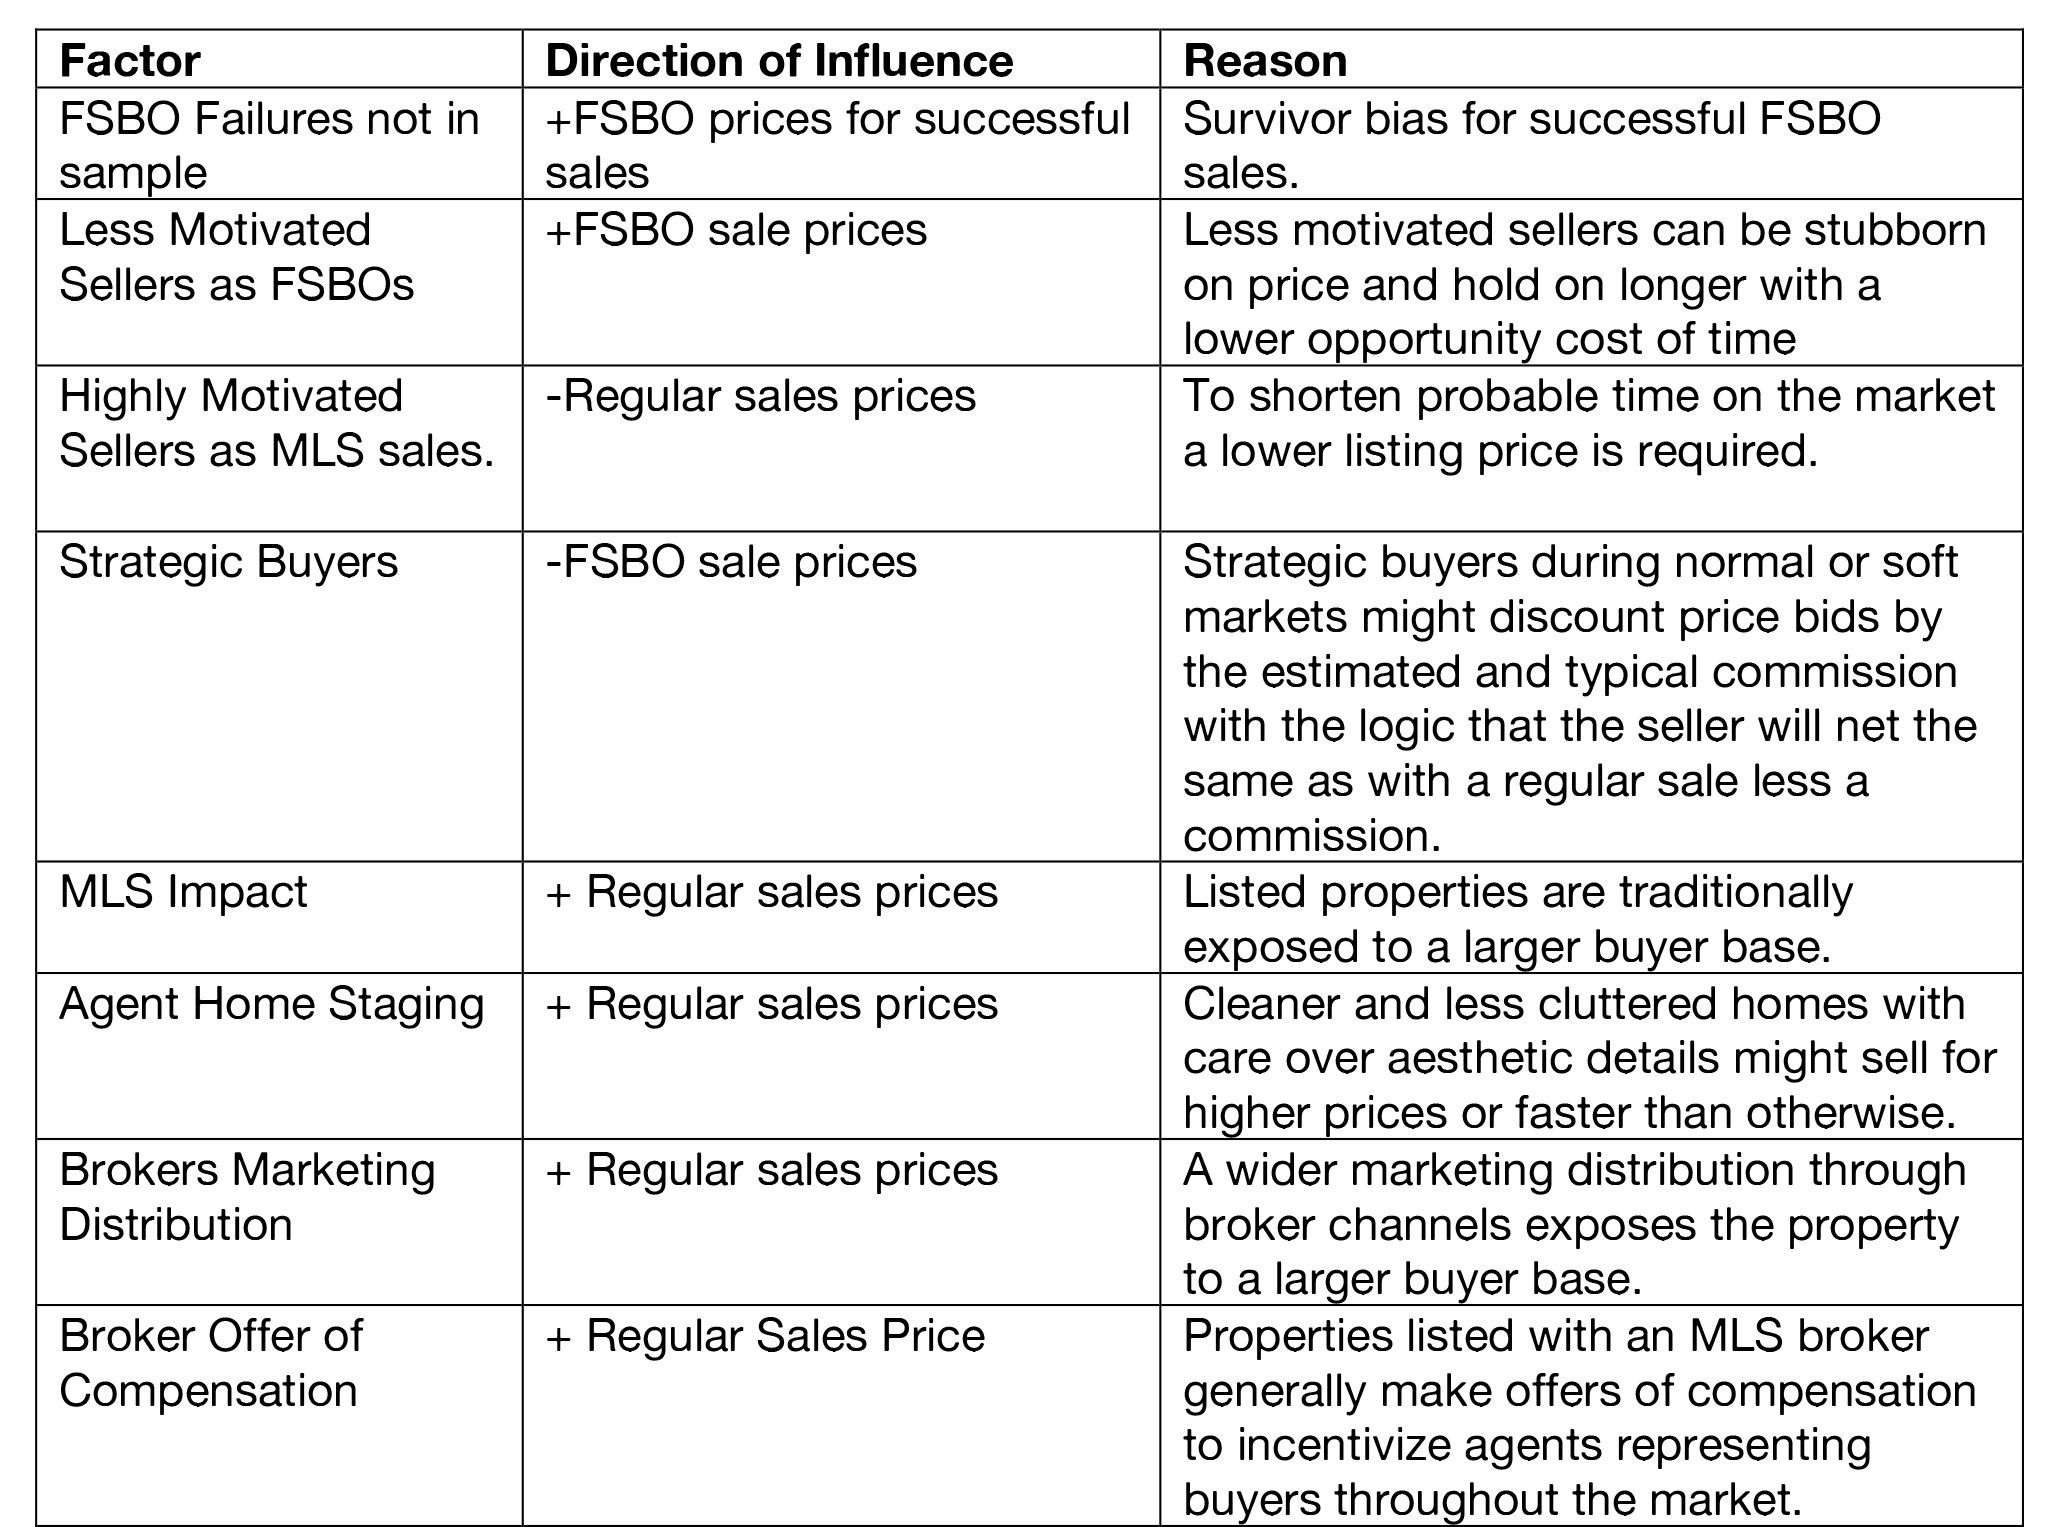
The extent to which of these factors dominates is not clear and may in fact change as a function of market conditions. Prior studies, as well as this study, may be subject to survivor bias or other unknown systematic differences. Here we improve upon past studies by including the largest and broadest database ever analyzed over a relatively normal market period. We use three methods to examine differences in selling prices of FSBOs versus regular sales: 1) Median sold price per square foot of living area of MLS vs. FSBO sales sorted by city and ZIP Code, 2) Hedonic models with a dummy variable for FSBO, and 3) Sold Price to AVM ratio for MLS sales and FSBOs, where the AVM is an independent estimate of property value based upon all property attributes.
Hypothesis
FSBO sales will, on average, sell for something less than comparable regular sales when markets are in equilibrium. For this hypothesis to be true, the last few factors, such as marketing, the MLS impact, and agent staging, would need to dominate the other possible factors.
Prior Literature
A number of papers have examined bargaining, economic incentives, and when to use a real estate broker, including Judd and Frew (1986) and Geltner, Kluger and Miller (1991), Salant (1991) Yavas and Coldwell (1999), Zumpano et al (1996), Munneke and Yavas (2001), Merlo and Ortalo-Magne (2004). The Geltner et al study suggests that agents are most incentivized by the traditional commission to simply sell the home and that it would take an entirely different kind of commission system, with a much higher percentage above some break price, to incentivize agents to maximize price. Since determining the fair market value of the property efficiently and objectively was problematic prior to 1991, they concluded the traditional commission system was not an unreasonable system.
Very few studies compare prices achieved on For Sale By Owners (FSBO) sales versus traditional marketing using REALTORs and the Multiple Listing Services (MLS). A 1990 study by Miller compared FSBO success rates, but not prices, and found that less than a third of all FSBO attempts were successful. Most FSBO sellers lost patience very quickly and ended up listing with an agent. This study was prior to the proliferation of public internet sites like Zillow, Redfin, Cyberhomes, which came on the scene at a later date. Some listing sites catered to FSBOs by market and were later studied in the literature discussed below.
In 1999, a paper by Crowston and Wigand speculated that the internet would break down the information monopoly of real estate agents, increasing the prospects for market disintermediation — in other words, increasingly successful FSBO sales. Surveys by the National Association of REALTORs do not support any wholesale increase in FSBO success, suggesting that other complications affect successful marketing of homes from staging to pricing to negotiation. Still, there have been a few studies comparing FSBO sales to regular sales in the post internet period.
Bernheim and Meer (2008) compare non-MLS listings with and without agents. They examine sales for Stanford faculty and staff using agents or a university internet platform and find that brokers accelerate sales but do not achieve higher selling prices. Another study with similar findings is by Hendel, Nevo and Ortalo-Magne (2009), which focuses on a single market, again one that is situated in a university town with highly educated households. The Hendel et al study compares sale prices, time on the market, and the probability of sale, but only for one market: Madison, Wisconsin. The data was collected from 1998 through 2005, a period of fairly rapidly rising prices in most markets. The cost to post on the FSBO platform was $150 while the cost of the typical home sale paid to brokers was a fairly uniform six percent of the sales price. The authors found that 20% of the FSBO listings did not sell and re-list on the MLS platform and that on average the MLS listed properties sold faster, which they attributed to platform scale. They stated: “Sellers may differ… in their patience or bargaining ability. More patient sellers are likely to get a better price whatever platform they choose. At the same time, more patient sellers may be more prone to list on FSBO. In that case, we will get a positive correlation between FSBO and sale price.” Hendel et al find an insignificant price premium for FSBO sellers compared to MLS sales, but with a longer time on the market. They also find consistent with Levitt and Syverson (2008) that REALTORs selling their own homes were able to sell at higher prices than others.
While not comparing FSBOs to regular sales, Jia and Pathak (2010) did compare homes for selling price and probability of sale based on variations in commission rates in the Boston market. They concluded “A higher commission is associated with a higher likelihood of sale, a modest impact on the days on the market and overall no effect on the sales price. It is possible that high commission agents realize lower sales prices to increase the likelihood of selling a property. This result would be consistent with agents not fully internalizing the interests of sellers, with high commission agents benefitting more from completing sales relative to obtaining higher prices for their clients.”
Data
Data was collected for sales that occurred in 2016 and part of 2017 from the following 13 counties: Los Angeles CA, San Diego CA, King WA, Clark NV, Maricopa AZ, Harris TX, Dallas TX, Fulton GA, Cook Il, Suffolk MA, Mecklenburg, NC, Prince George’s MD, and Fairfax VA. The 13 counties generated more than 1.35 million sales for our sample, broken down into 454 discretely defined areas (which could include cities, towns, villages, or other incorporated areas) and 1,008 ZIP Codes.
Below we describe the final sample used for analysis. At the county and area level, all sales were used, but when we ran an automated valuation model (“AVM”) to control for age and other property attributes, only those observations with an AVM that was associated with a confidence score of 80% or better were included.[2] The AVM used is a retro valuation model as developed by Collateral Analytics. It uses a variety of models including hedonic regression type models and is established as among the leading vendors in the AVM industry.
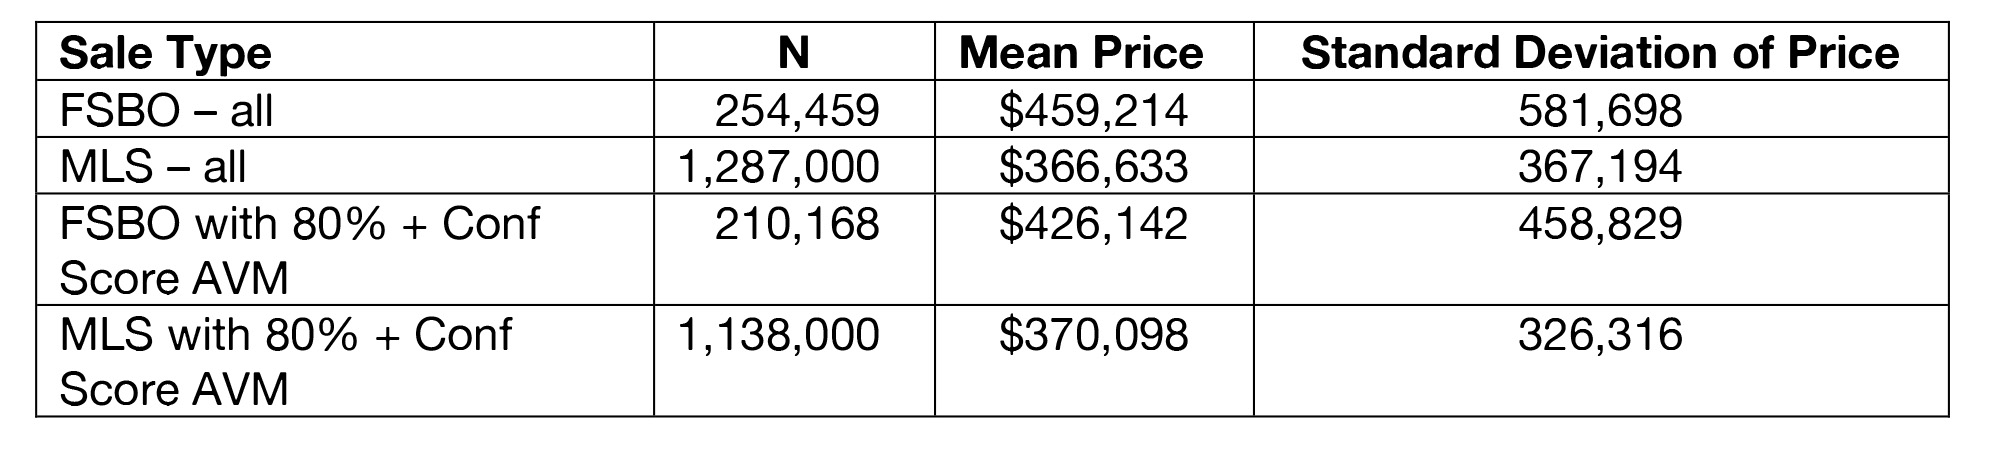
Data Summary Statistics: Sample Size, Mean and Standard Deviation
Descriptive Results
Aggregate analysis:
In the first two Exhibits, we provide a simple comparison of the price-per-square foot of FSBO sales versus MLS sales, which controls for the size differences of properties and in aggregate might provide a reasonable first-cut comparison. Exhibit 1 makes the comparison for 454 municipal areas, and reveals an average differential of a 5.02% lower price-per-square-foot for FSBO sales as compared to MLS sales. Exhibit 2 makes the same comparison, but for 770 ZIP Codes where we had significant samples during 2016, and this time the result is a price-per-square-foot differential 7.26% lower for FSBO sales than MLS sales. [3] Both results suggest that sellers would be ill-advised to sell their own property.
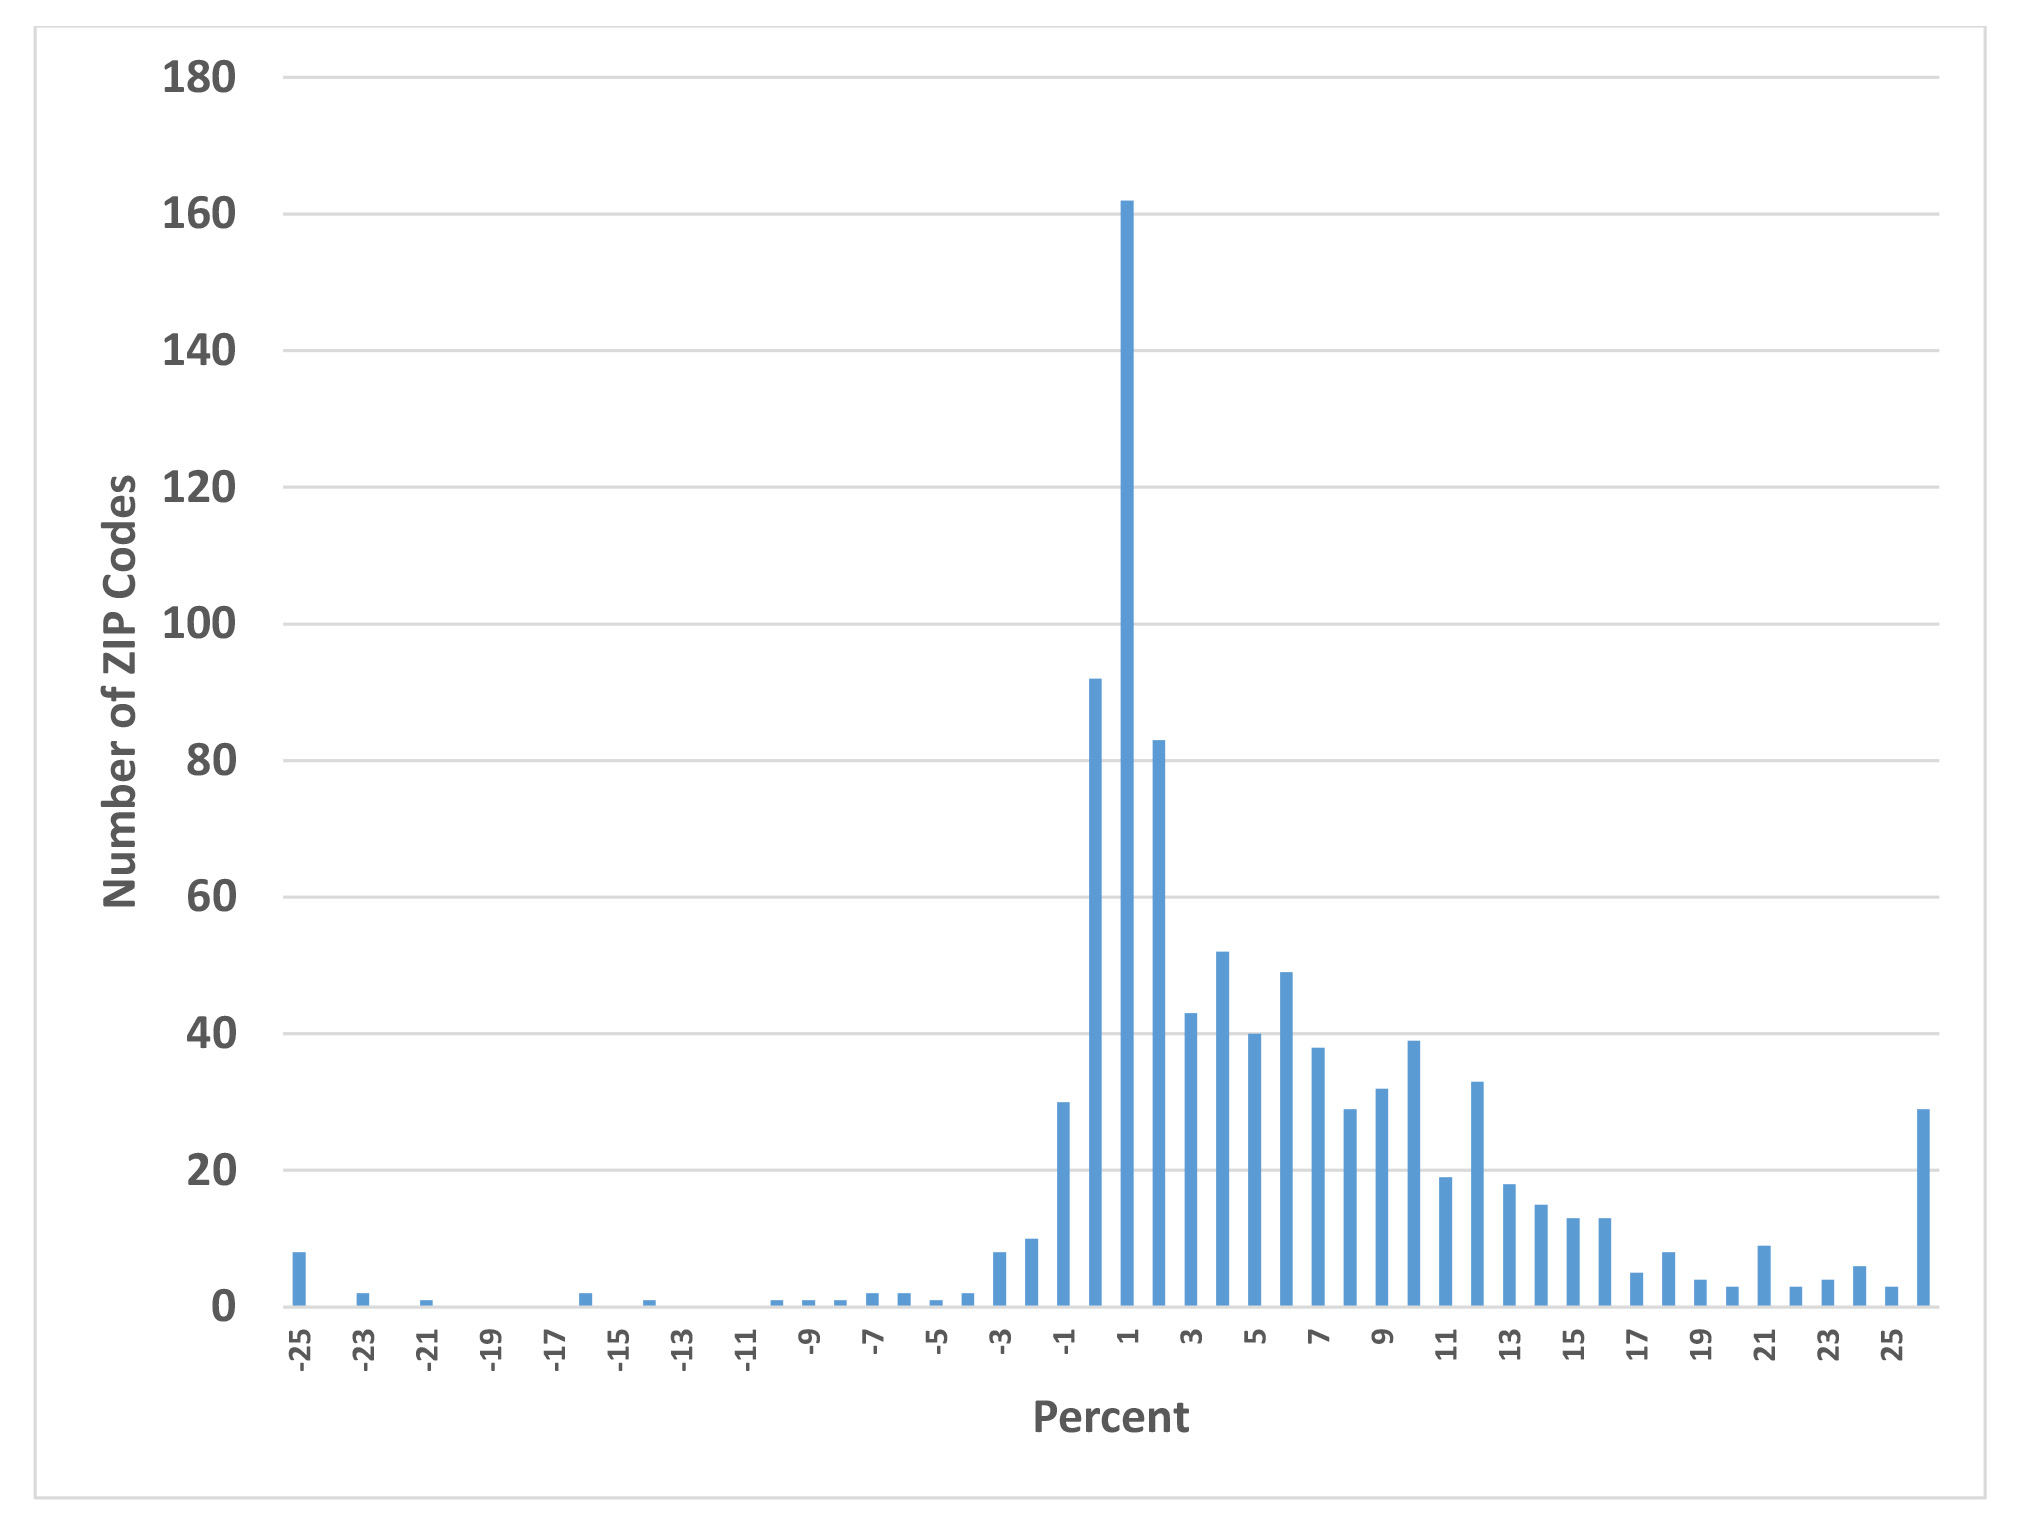
Because ZIP Codes should be more homogeneous than cities, we continued to dig down with more controls for other factors influencing value. In Exhibit 3, we compared the selling price to an estimate of value by an AVM for all the sold properties where the AVM confidence score for value accuracy was 80% or higher.[4] Some 1.35 million sales are included, with 210,168 (15.6%) of them FSBO sales. Keep in mind the AVM is an independent estimate of the property value based on a combination of models including hedonic and other models.[5] The result in this most detailed and most comprehensive comparison suggests an average difference in the sale price for FSBOs of -5.526% when compared to MLS regular sales that on average match the AVM. One should note the variation of the price difference distribution is much tighter in Exhibit 3 with the graph x axis running from -25% to +27.5% while the price per square foot comparisons by city and ZIP Code run from -50% to +50%. Thus, the AVM control dramatically reduces the range of dispersion and it is a more reliable indicator of the sales price results for FSBO versus regular MLS sales.
We considered whether the average FSBO prices were lower in the aggregate based on the lower quality of the homes (age, size, etc.) not controlled for by the AVM, but in this case the average sale price of the FSBOs is 15% higher than the average price of MLS sales. The fact that average FSBO prices might exceed those of the MLS in aggregate can help explain why one might (in other studies) have concluded that FSBO sales prices equal or exceed those of the MLS as observed in some prior studies when aggregate methods were used for comparison.
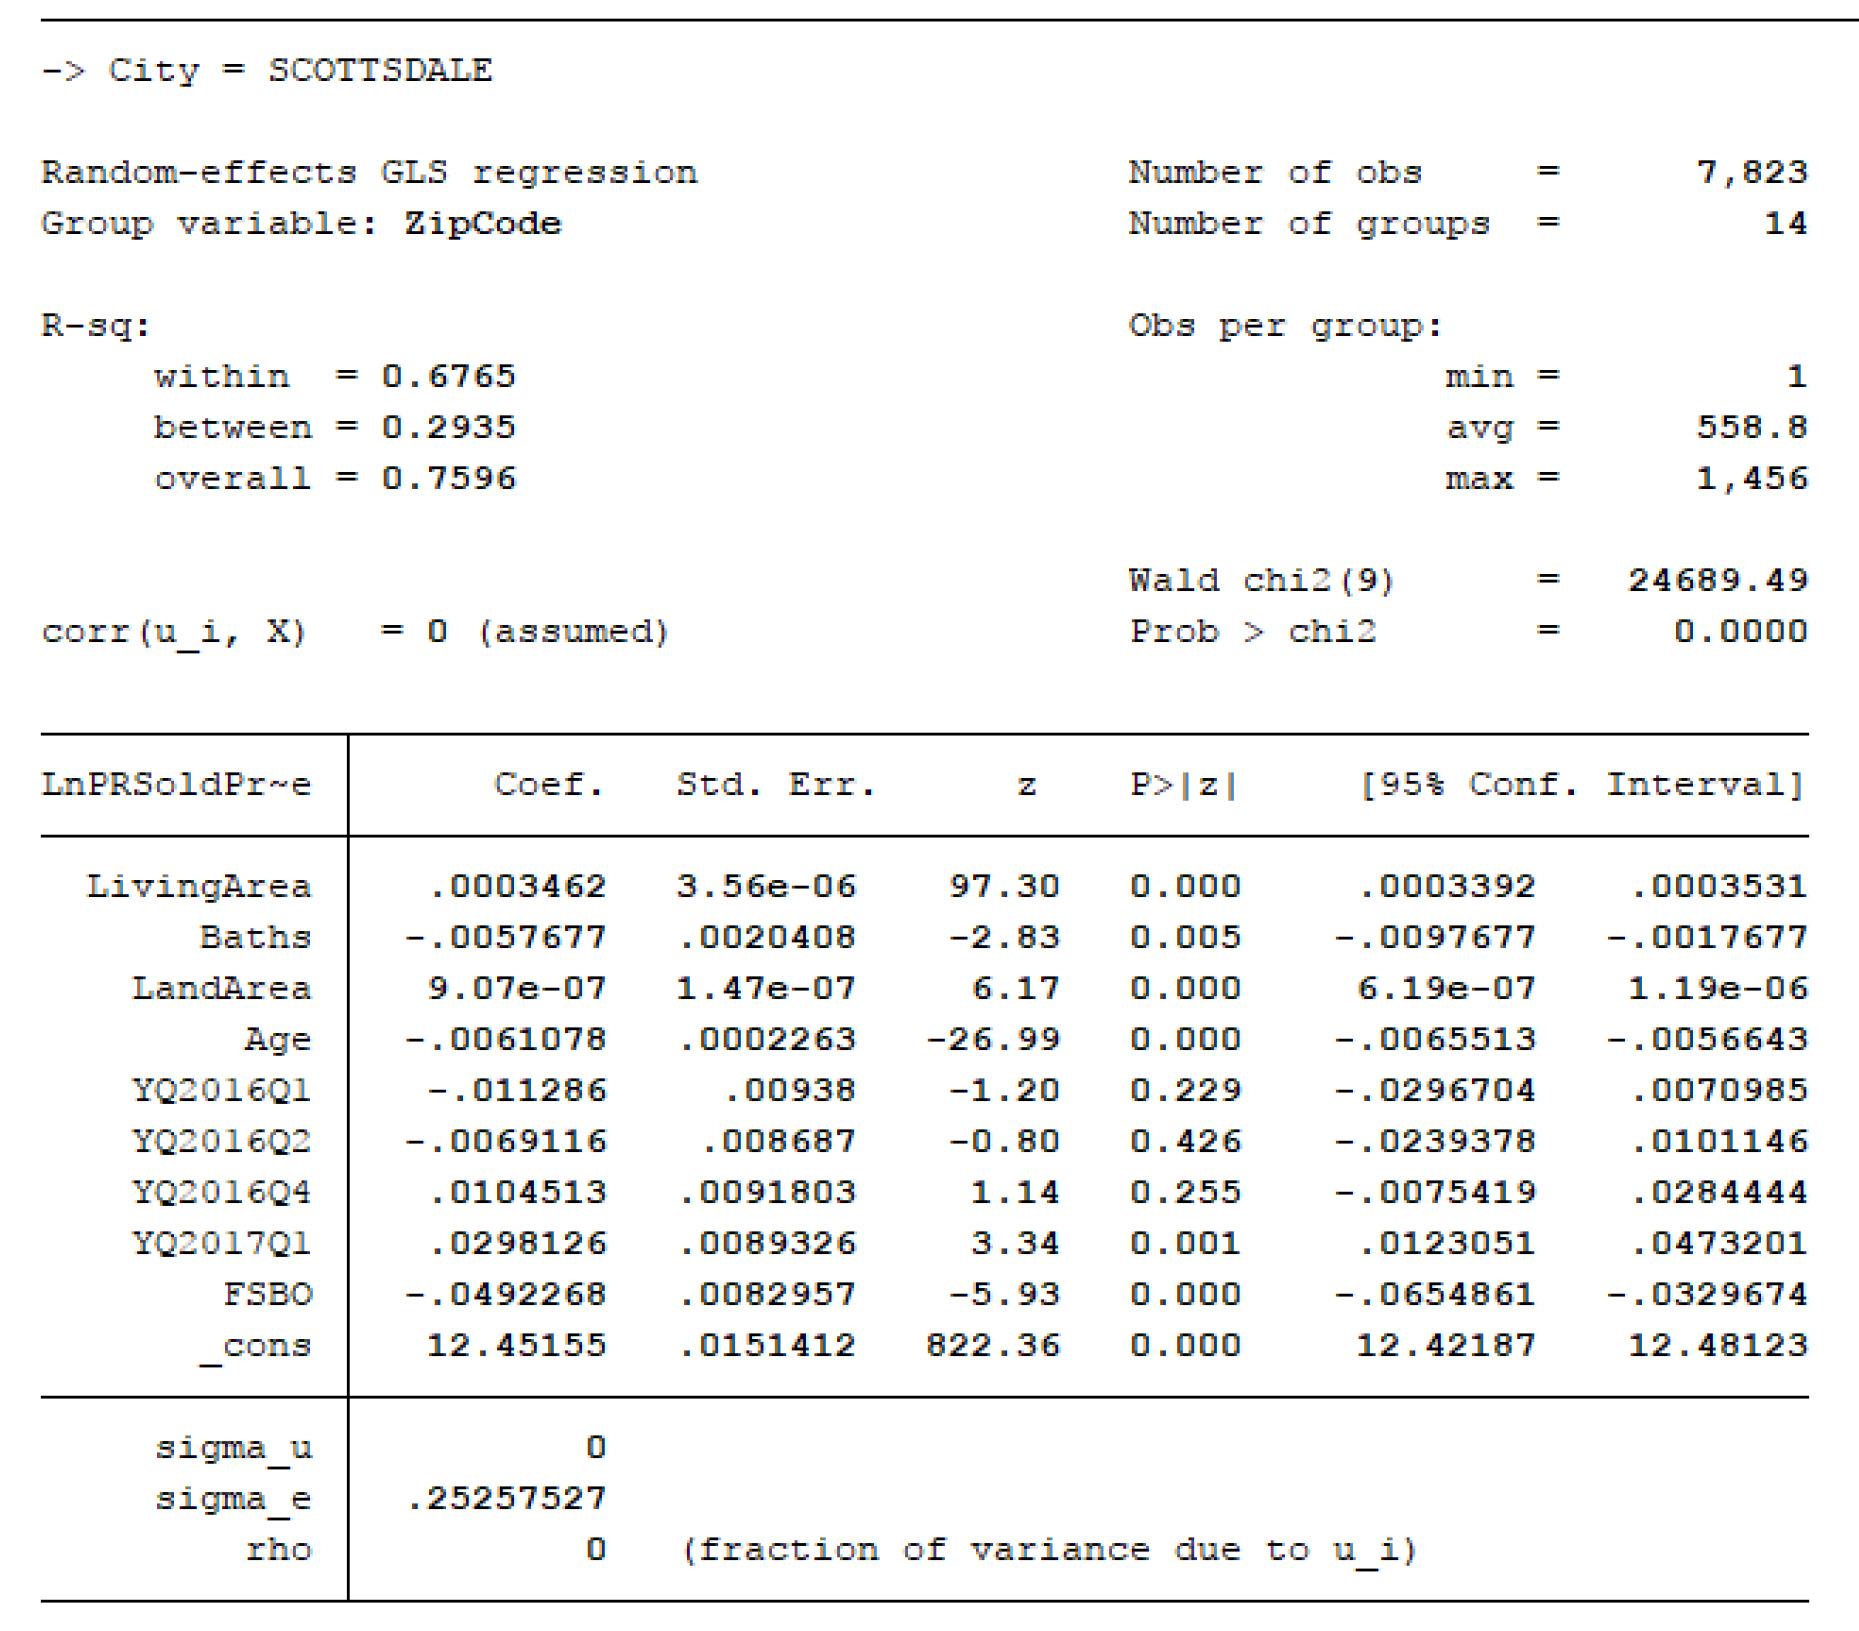
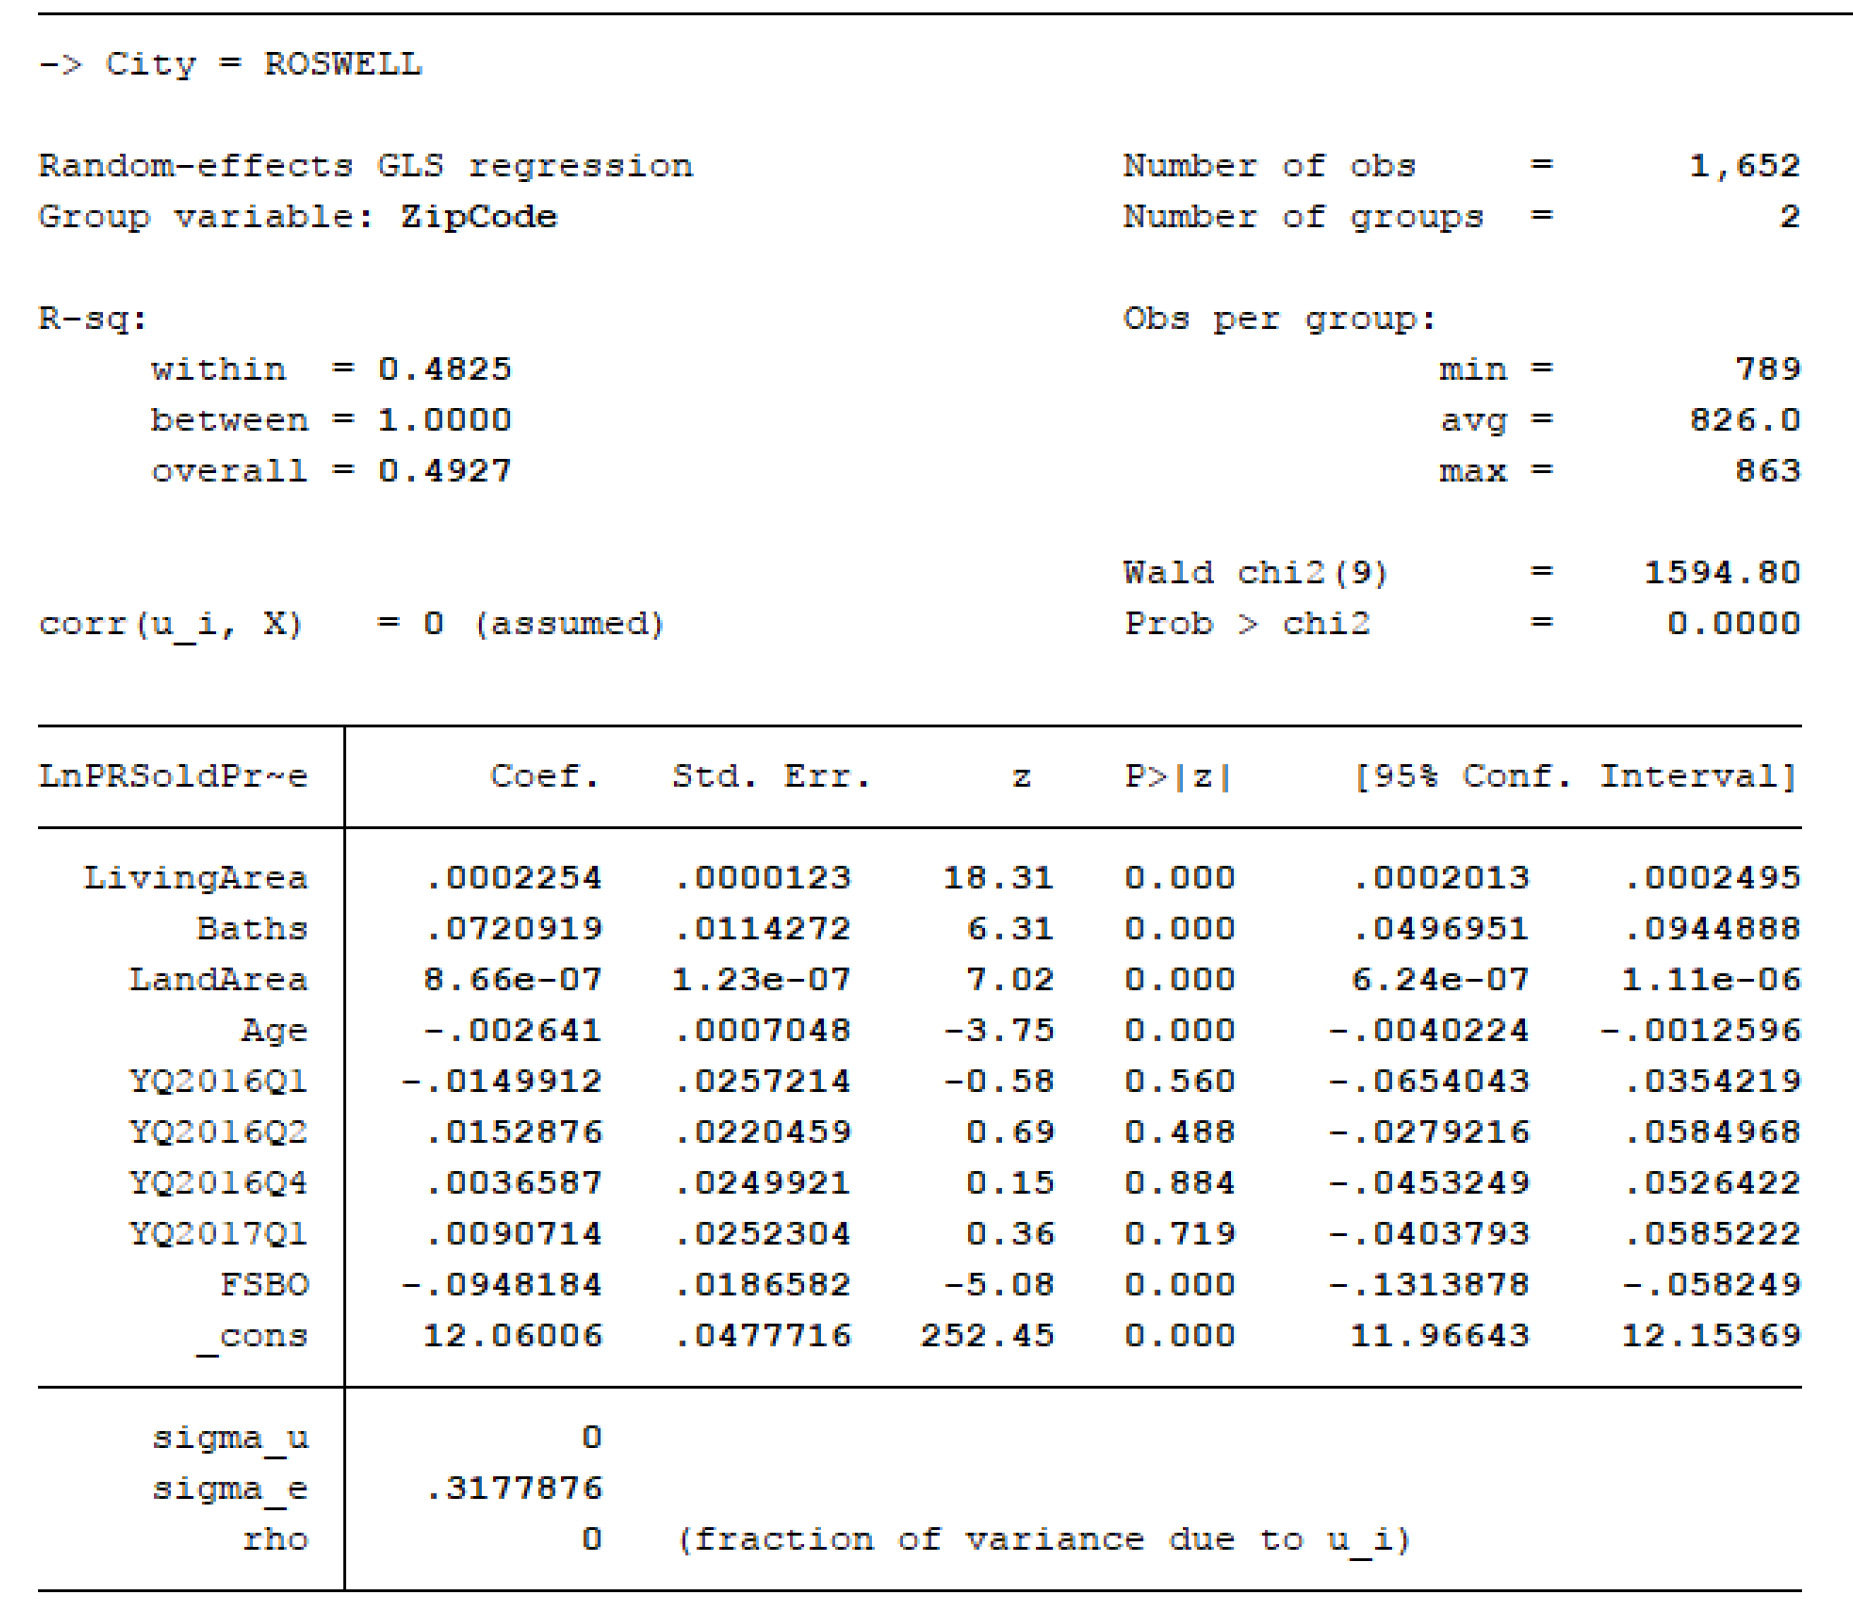
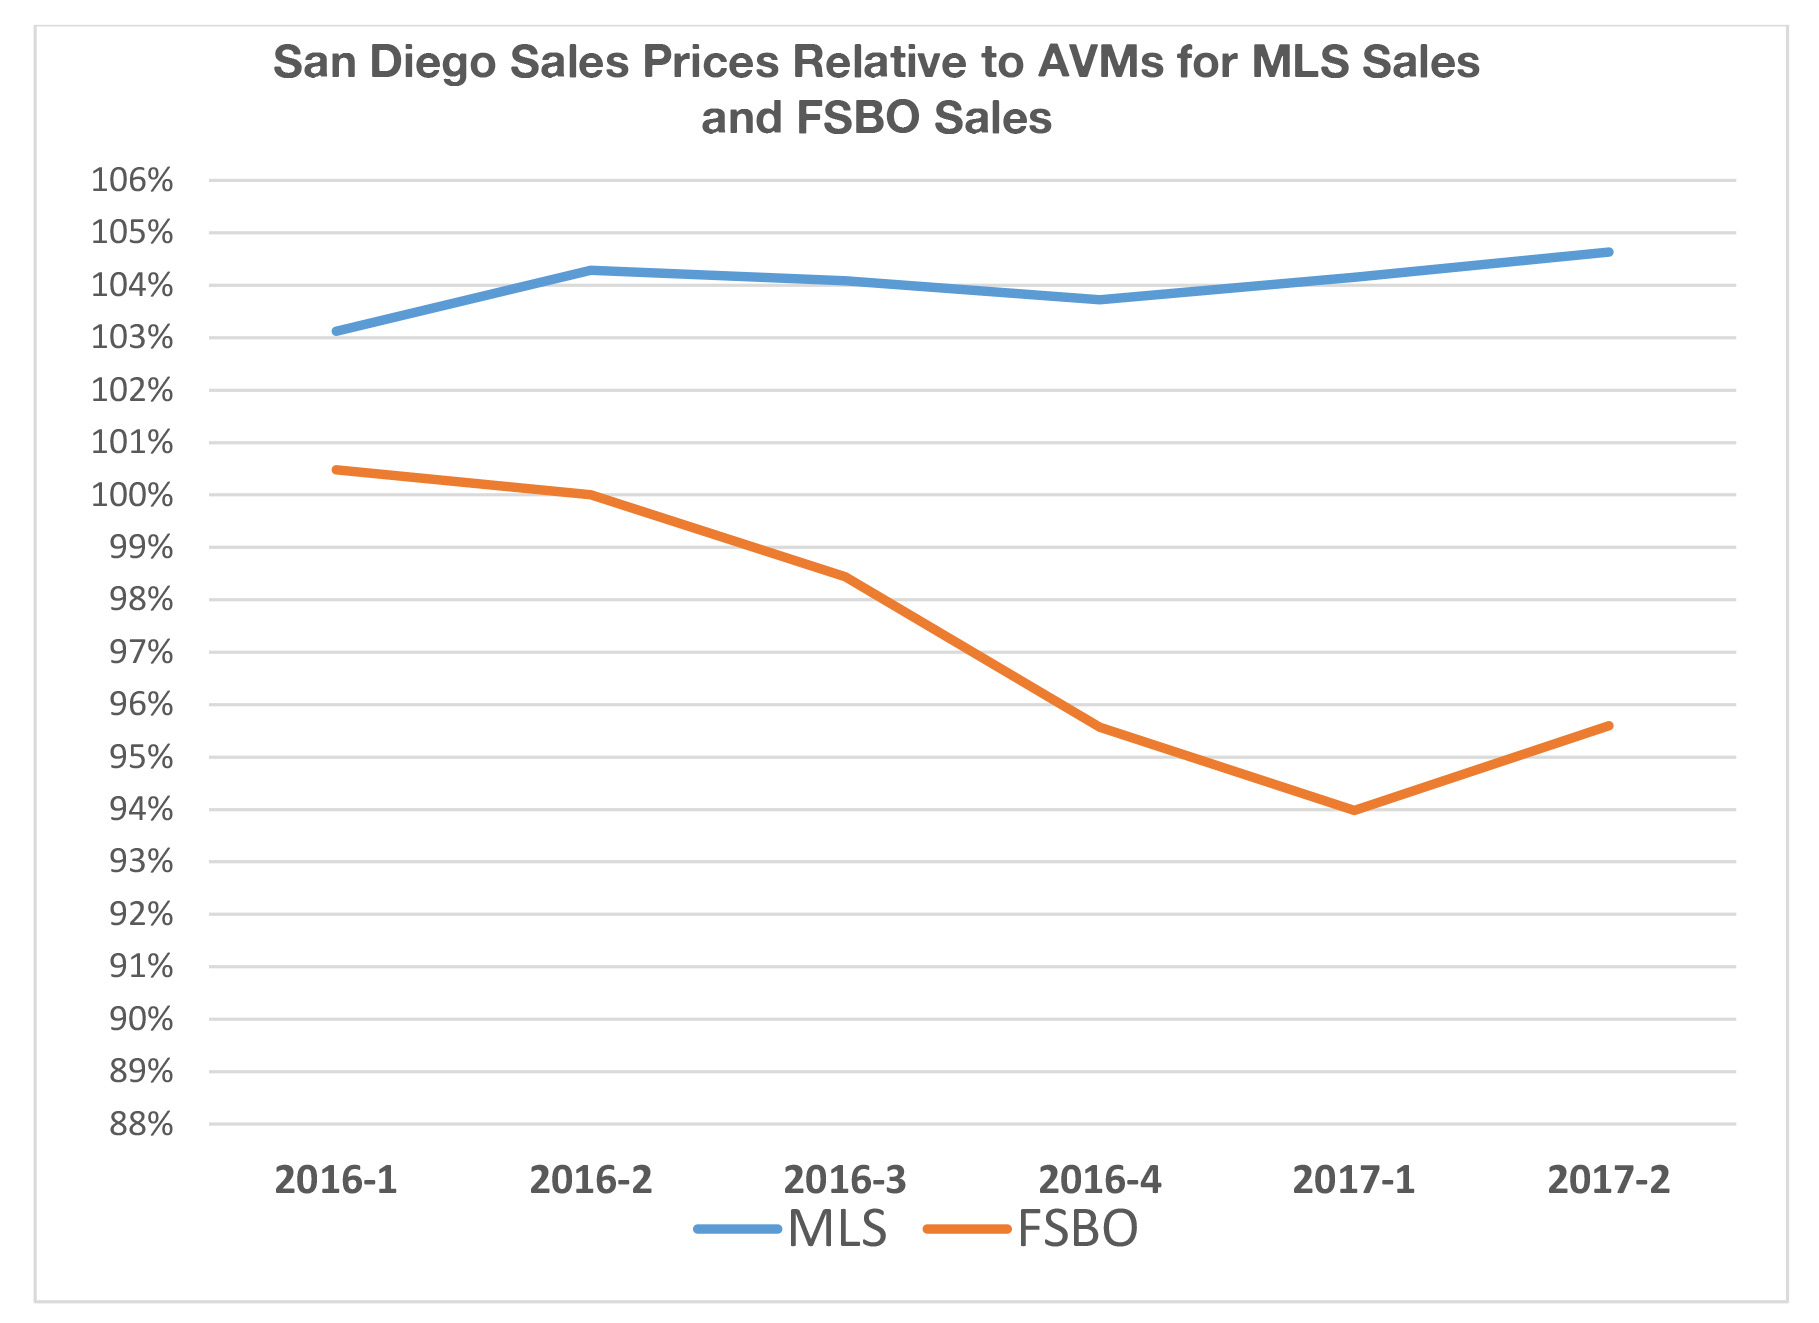
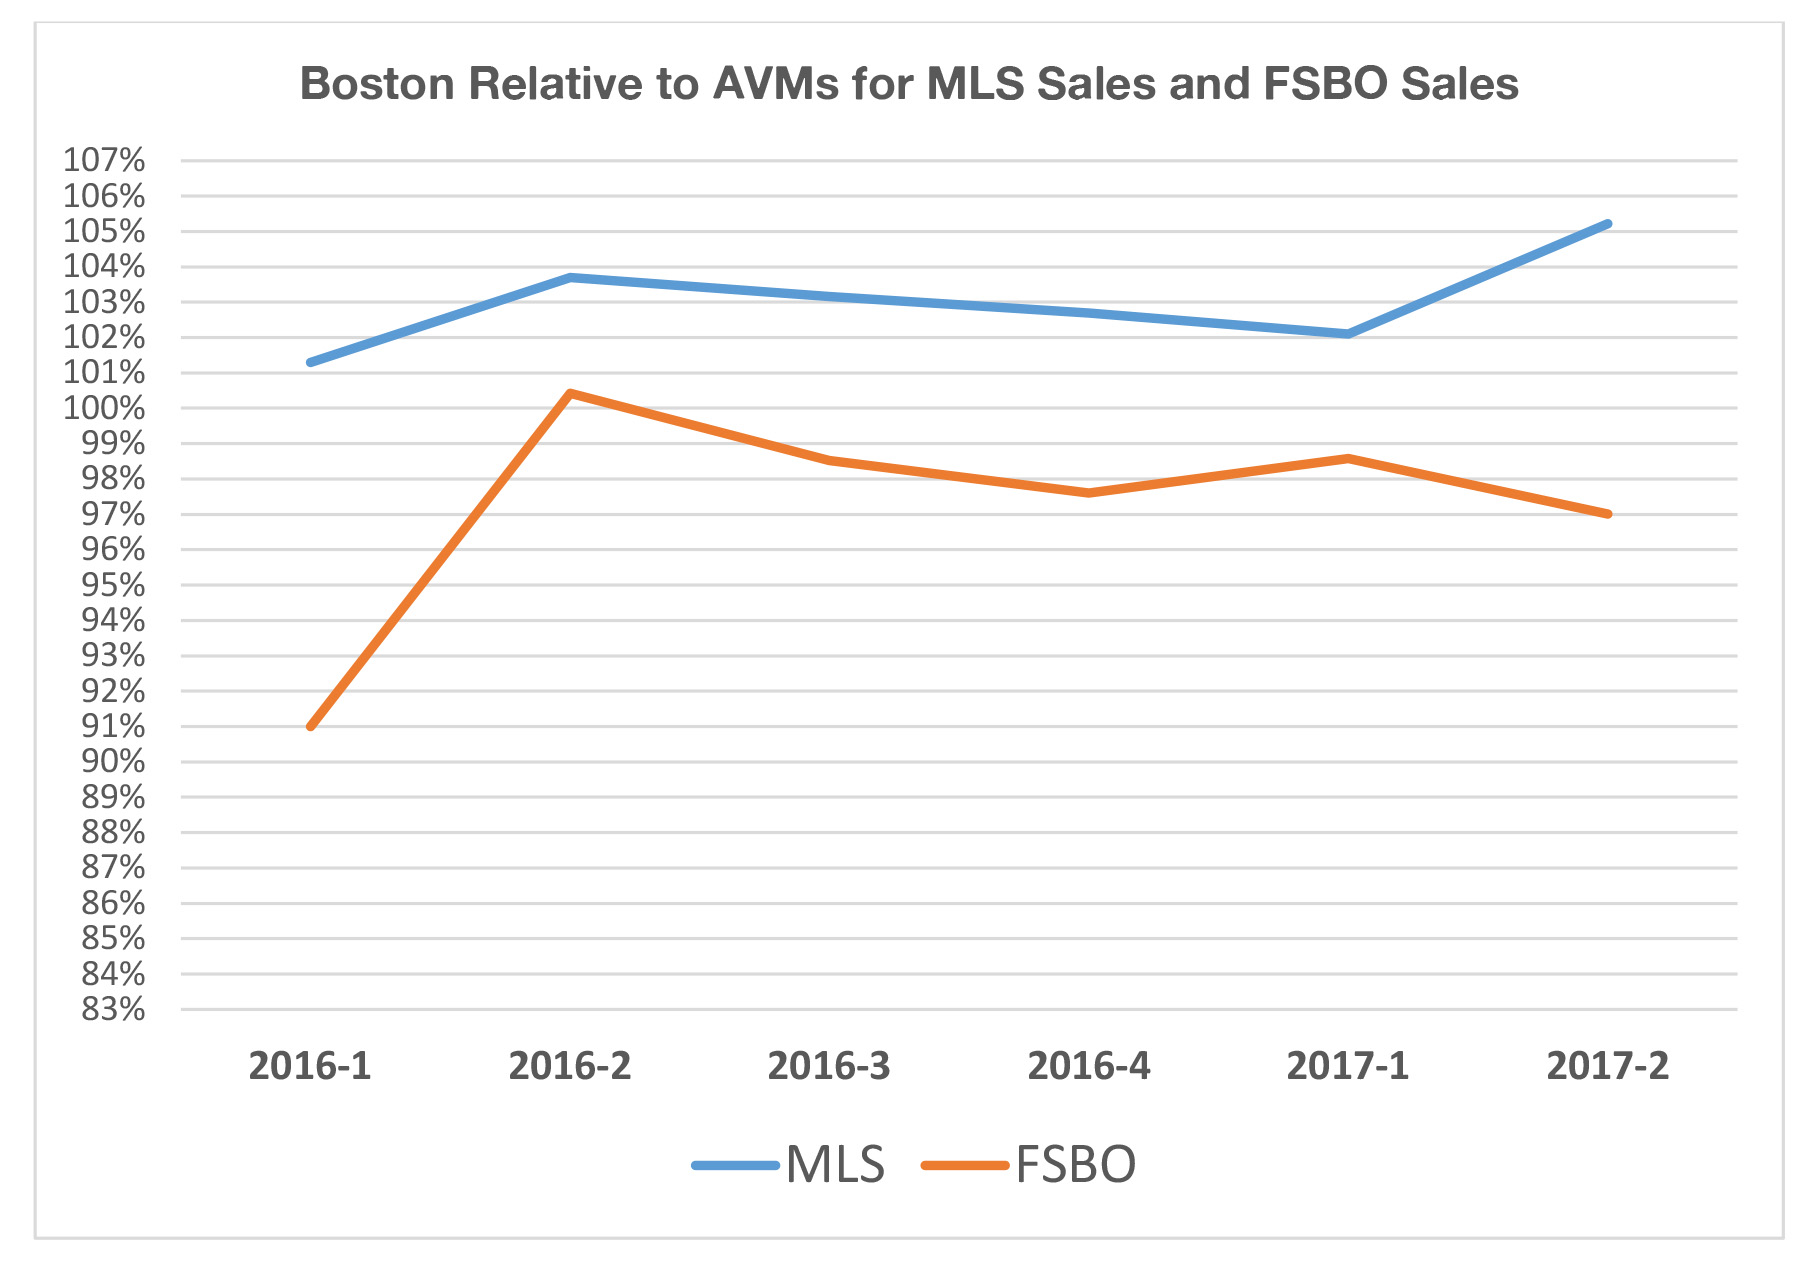
In Appendix 1, we present Regressions with FSBOs as a dummy variable, where we observe a -6% and -9.7% for Scottsdale, AZ and Roswell, GA. respectively, for FSBO sales compared to MLS sales. The average result for all markets tested was around -6% again for FSBO sales compared to regular MLS sales, but the variation of results was quite high because of some small sample sizes for the FSBO sales. Last, in Appendix 2, we show a sample of results by quarter for 2016 and half of 2017 comparing MLS sales to FSBO sales. Here we observe that the differences are not constant over time nor by market. In some markets, like Boston, MA the average difference is about 6.1% over the six quarters, while it was 6.9% in San Diego, CA and 10.9% in Phoenix, AZ. What this suggests is that sample size matters, market conditions may matter, and other biases in samples could affect prior study results. We feel this is the most robust test yet, certainly at least the largest sample ever tested, comparing FSBO sale price results to regular sale prices via the MLS.
Exhibit 1: Frequency Table of Single Family Price Per Square Foot of Living Area for Regular Sales Versus FSBOs for 454 Municipal Areas
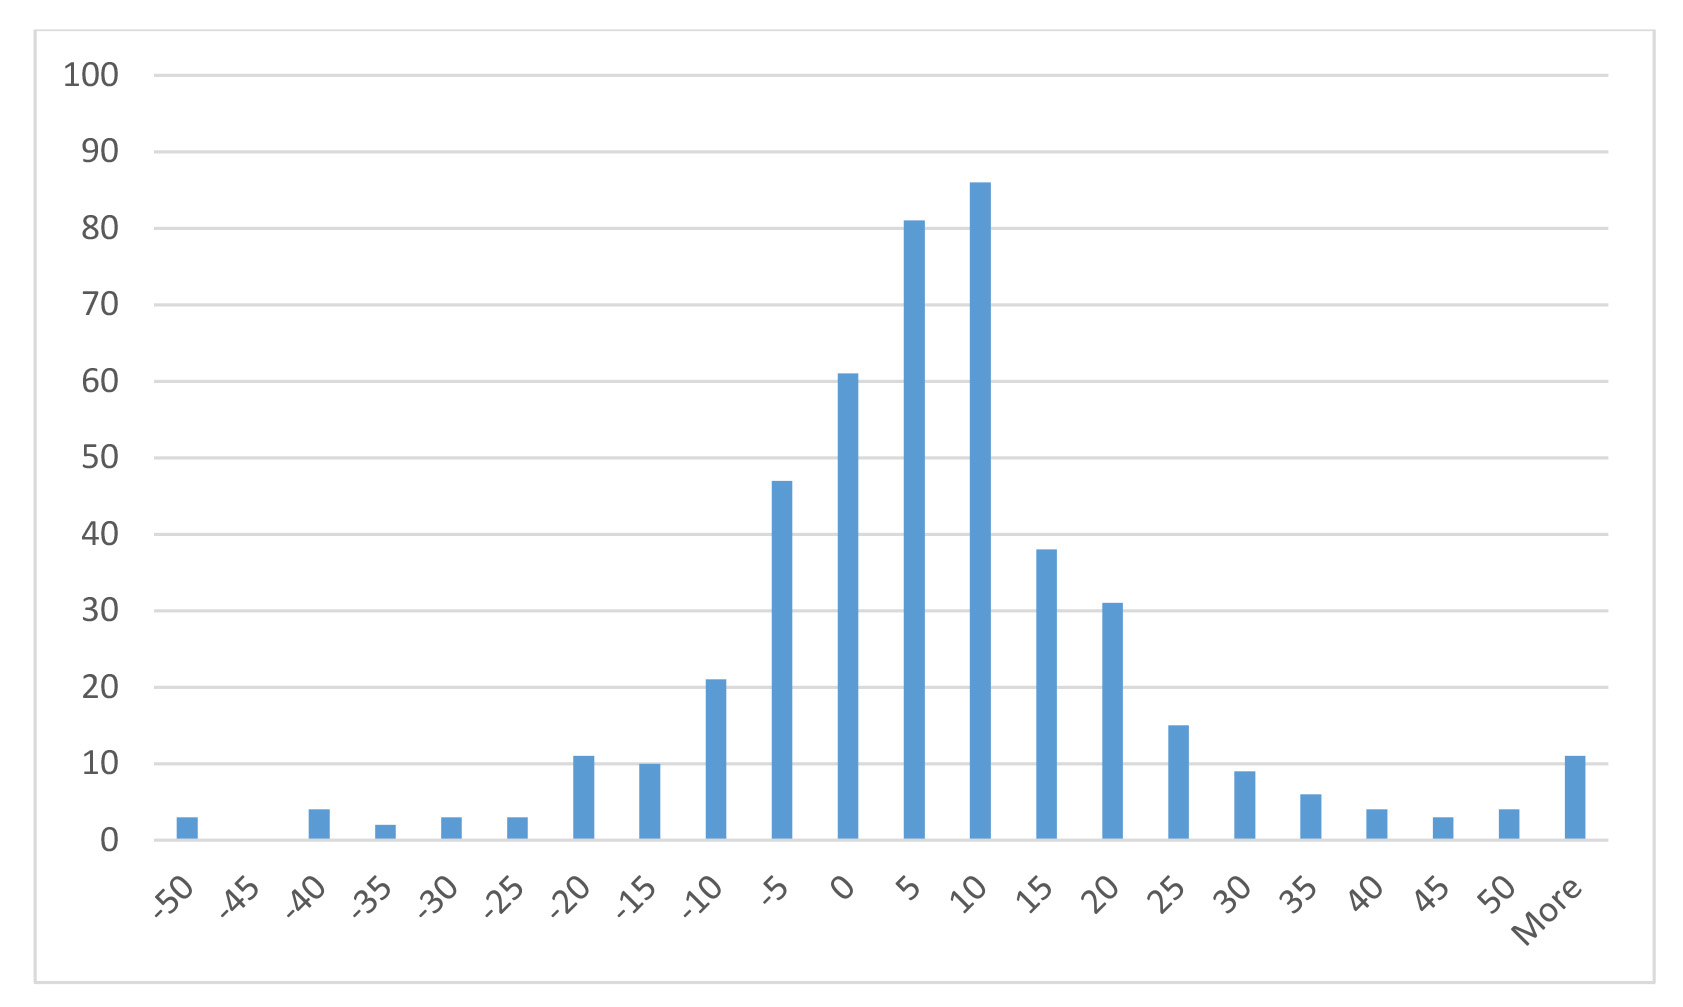
Exhibit 2: Frequency Table of Single Family Price Per Square Foot of Living Area for Regular Sales Versus FSBOs for 770 ZIP Codes
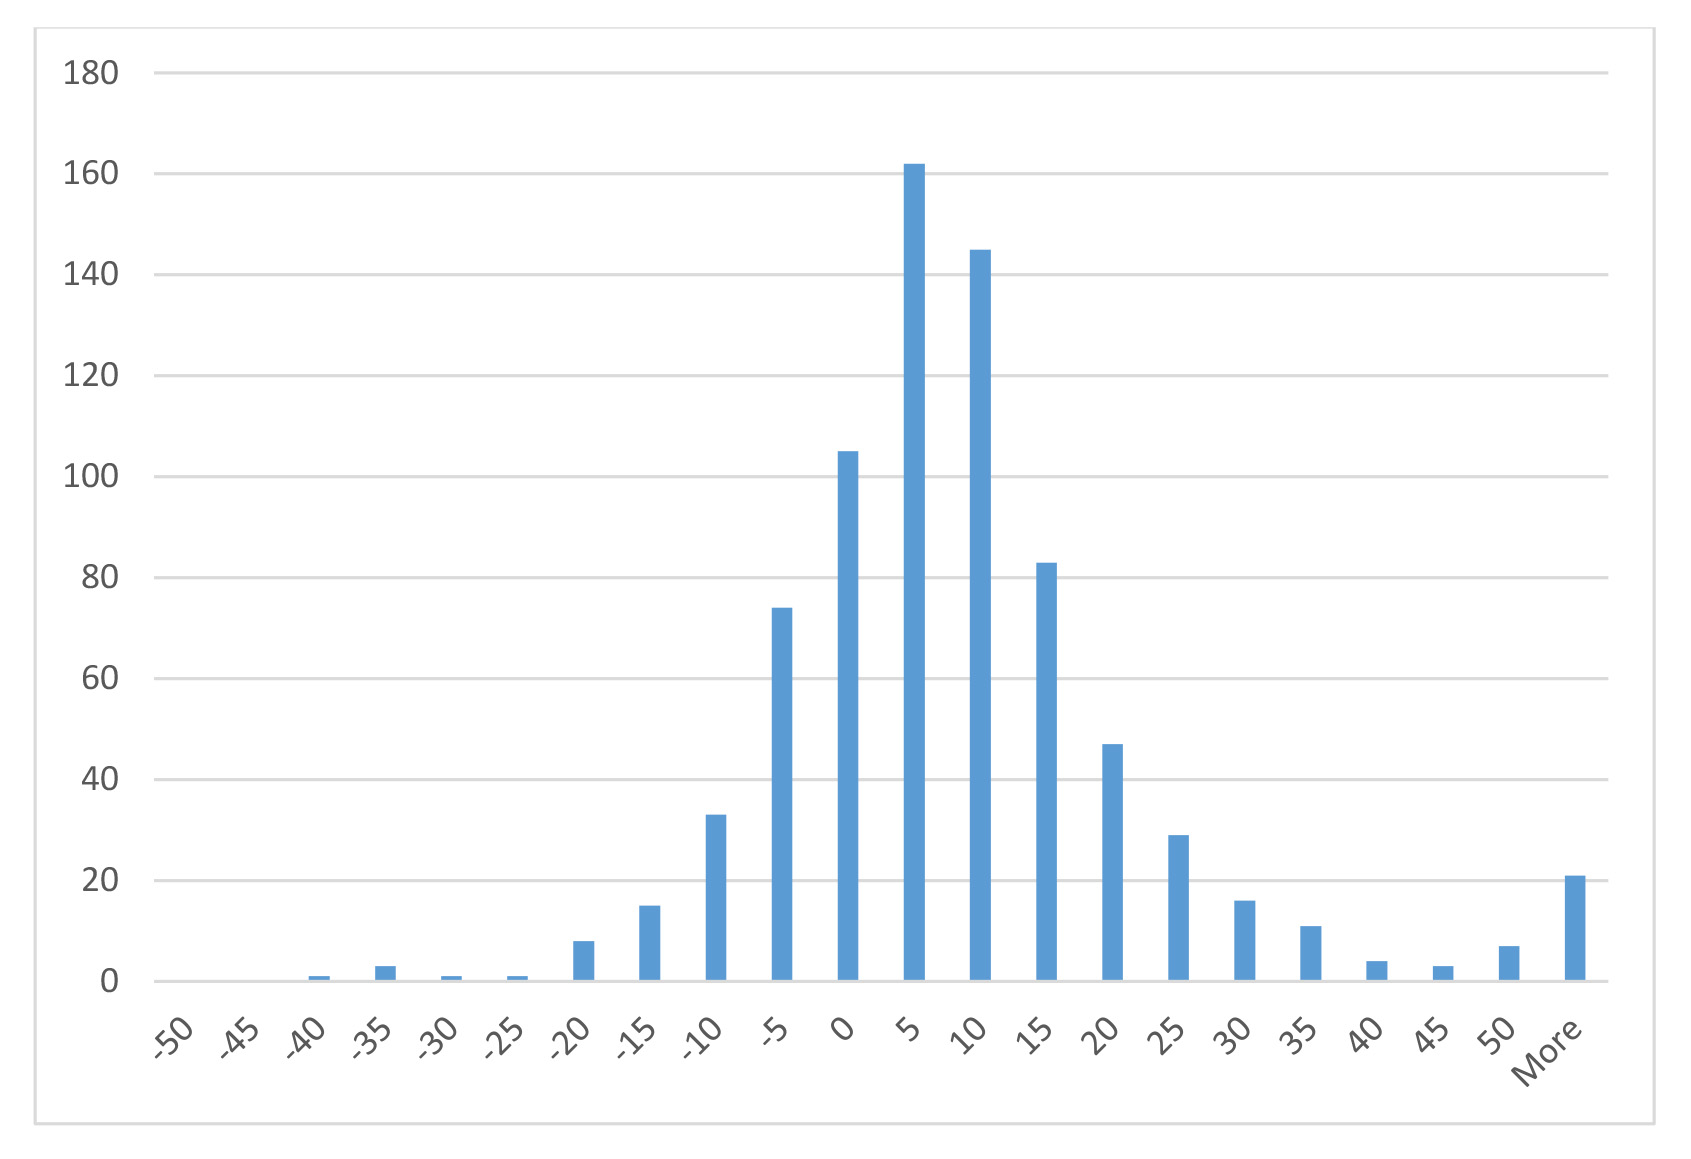
Exhibit 3: Frequency Table of Single Family Median Price Per Square Foot of Living Area for Regular Sales Versus FSBOs for 1.35 million properties compared to an AVM estimate of value, grouped by ZIP Code average results.
Conclusions
This results from this study suggest that successful FSBO sellers achieve prices significantly below those from similar properties sold more traditionally by REALTORs via the MLS. The data used for this study came from a rather normal housing market, not one in rapid rise or decline, and covered all of 2016 and the first half of 2017. Some 15.6% of the sales transactions in this study are from successful FSBO sales. It is not known what percentage of all sales are initially FSBO attempts, but it is certainly higher than the 15.6%. This percentage of successful FSBOs seems not unlike those from a few decades ago, despite the proliferation of public internet listing sites, but further study is needed to identify if FSBO success is increasing or decreasing.
Using three different sorts of the data and methodologies, we find that the differential in selling prices for FSBOs when compared to MLS sales is remarkably close to average commission rates. Here we find an average difference of about 5.5% lower prices achieved for FSBO sales compared to MLS sales for similar property, using the most accurate method ever used to control for property differences. Our aggregate analysis for the data during 2017 suggested even larger differentials. In some markets, the differences based on regression models are slightly higher or lower and while they seem to vary over time, the average was near 6% lower for FSBO sales. Prior studies often focused on one metro, much smaller samples, and used fewer controls for property attribute differences.
Assuming that both buyers and sellers pay the commission, one might have expected something less than this average -5.5% result. It appears that many sellers are avoiding commissions while netting home prices less than they would with an agent-represented MLS sale. They are avoiding commissions at any price, even one that exceeds the commission rate. Perhaps buyers do make low-ball offers to FSBO sellers deducting the entire commission, not just the seller’s portion, in their offers? That would explain the results observed here.
References
Bernheim, B. Douglas, and Jonathan Meer. 2008. “How Much Value Do Real Estate Brokers Add? A Case Study.” National Bureau of Economic Research Working Paper 13796.
Hendel, I., A. Nevo, and F. Ortalo-Magne, 2009, “The Relative Performance of Real Estate Marketing Platforms: MLS versus FSBOMadison.com” American Economic Review, 99(5), 1878-1898.
Geltner, David, Brian Kluger and Norm Miller 1991,” Optimal Price and Selling Effort from the Perspectives of the Broker and Seller”, Real Estate Economics, 19:1, 1-24.
Jia, Panle, and Parag Pathak, 2010, “The Impact of Commissions on Home Sales in Greater Boston:, Papers and Proceedings, MIT Working paper 7698.
Jud, G. Donald, and James Frew. 1986. “Real Estate Brokers, Housing Prices, and the Demand for Housing.” Urban Studies, 23(1): 21–31.
Levitt, S. and C. Syverson, 2008, “Market Distortions when Agents Are Better Informed: The Value of Information in Real Estate Transactions.” Review of Economics and Statistics, 90(4), 599–611.
Merlo, Antonio, and François Ortalo-Magné. 2004. “Bargaining over Residential Real Estate: Evidence from England.” Journal of Urban Economics, 56(2): 192–216.
Miller, Norm, “FSBO Sales Versus Traditional Sales” Ohio State Center for real Estate Research Papers, Nov. 1, 1990.
Munneke, Henry J., and Abdullah Yavas. 2001. “Incentives and Performance in Real Estate Brokerage.” Journal of Real Estate Finance and Economics, 22(1): 5–21.
Salant, Stephen W. 1991. “For Sale by Owner: When to Use a Broker and How to Price the House.” Journal of Real Estate Finance and Economics, 4(2): 157–73.
Yavas, Abdullah, and Peter Colwell. 1999. “Buyer Brokerage: Incentive and Efficiency Implications.” Journal of Real Estate Finance and Economics, 18(3): 259–77.
Zumpano, Leonard V., Harold W. Elder, and Edward A. Baryla. 1996. “Buying a House and the Decision to Use a Real Estate Broker.” Journal of Real Estate Finance and Economics, 13(2): 169–81.
Appendix 1: Sample Regressions for Aggregate City Level Analysis with FSBO dummy variables Scottsdale
Roswell
Appendix 2: Sample Results by Metro of Regular MLS Sales versus FSBOs

Download a PDF file of this research paper here.
[1] By “full service” we mean a listing where the brokerage firm provides MLS listing, promotion, and coordination of marketing and communications with potential buyers and agents, contract negotiation, assistance with eliminating contingencies, and assisting as necessary to complete the sale. Disclosure forms and legal regulatory compliance with state laws are also handled by full service agents. There are various degrees of full service we discuss later in this paper.
[2] An 80% confidence score suggests that the standard deviation of the estimate is low enough that we have an 80% confidence that the value estimate is within 10% of true value as derived by using the sales prices of all observations in each market. When aggregated into groups this provides an extremely accurate estimate of market value.
[3] For 2017 sales year to date the average differential is -13.87% for FSBO sales and 414 ZIP Codes have significant sized samples.
[4] This probability estimate is 80% or higher within 10% of true value based on the standard error of the estimate.
[5] The model used is from Collateral Analytics, a leading vendor based on accuracy and hit rate. More details can be found by going to the website at www.collateralanalytics.com