Download a PDF file of this research paper here.
Introduction
Our recent Research Articles on forecasting home prices have focused on short-term indicators such as Months of Inventory Remaining and our composite indicator to rate macro or micro level market conditions. This article discusses what we have found to be the best intermediate to longer term predictor of home prices which is employment growth. Most econometric models that forecast housing prices will include employment trends and various other drivers of demand such as household incomes, mortgage rates, credit access, and past price trends. Here we focus on only employment by asking the question: At the metropolitan CBSA level how much do changes in longer-term employment drive housing prices?[1] In addition, we include one other variable which varies by market, that is barriers to supply. Our analysis is a 20-year snapshot, and concludes that indeed employment, as driven by the local economic base of each market, matters a great deal. Supply barriers also matter, but not as much.
Starting with the Big Picture
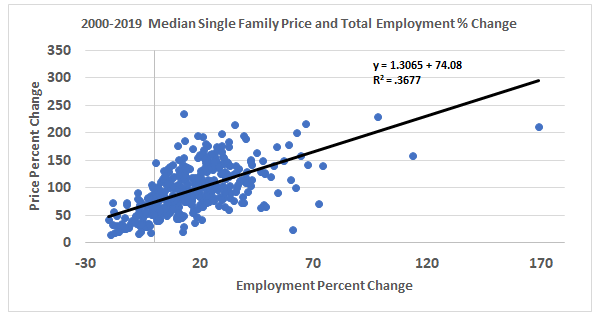
In Exhibit 1, below, we show the change in employment over a 20-year span versus the change in single family home prices for some 400 metros in the form of a simple scatter diagram. One can see the general correlation between employment change and price change. The actual relationship for a simple linear fitted trend line suggests a 1.3 multiple for the change in home prices relative to the change in local employment. The R squared is .3677 for price change relative to employment change.
Exhibit 1: All CBSAs and Single-Family Price Changes Versus Employment 2000-2019
Focusing on the Larger Markets
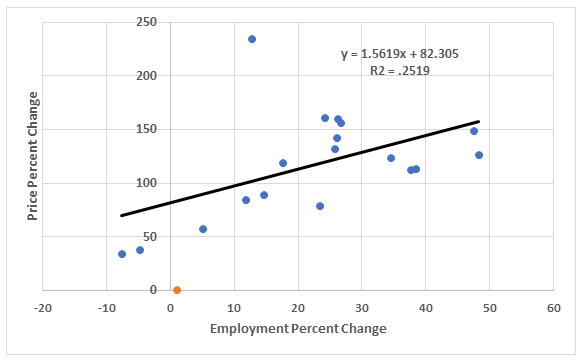
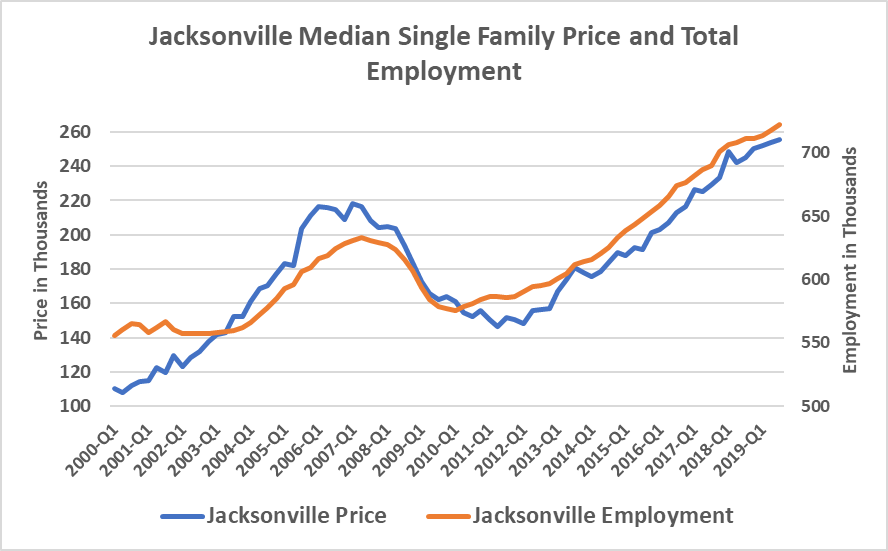
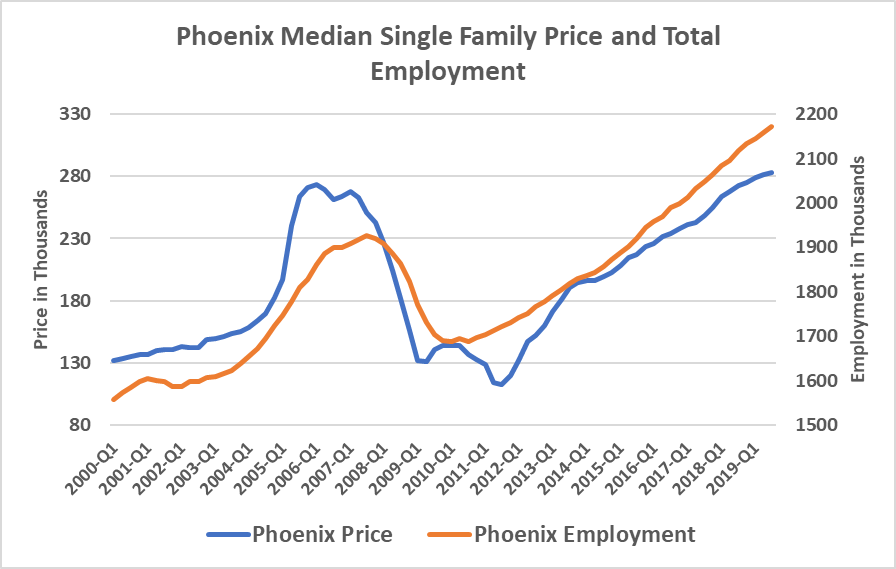
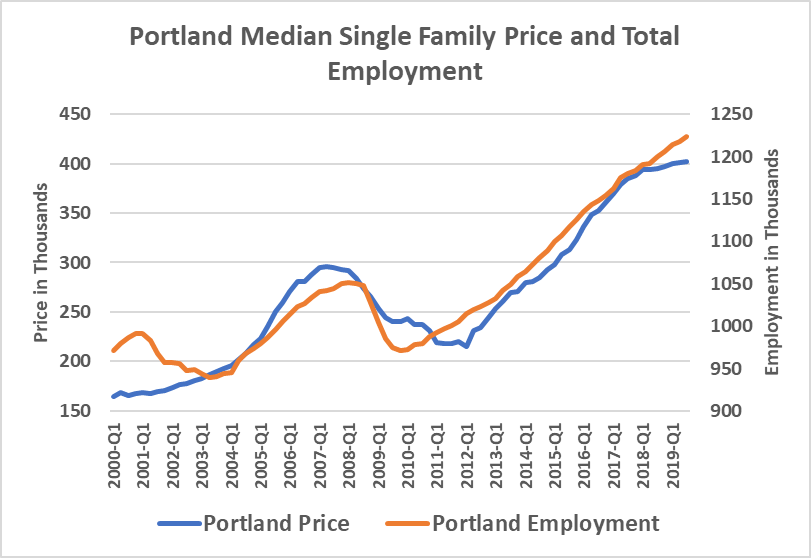
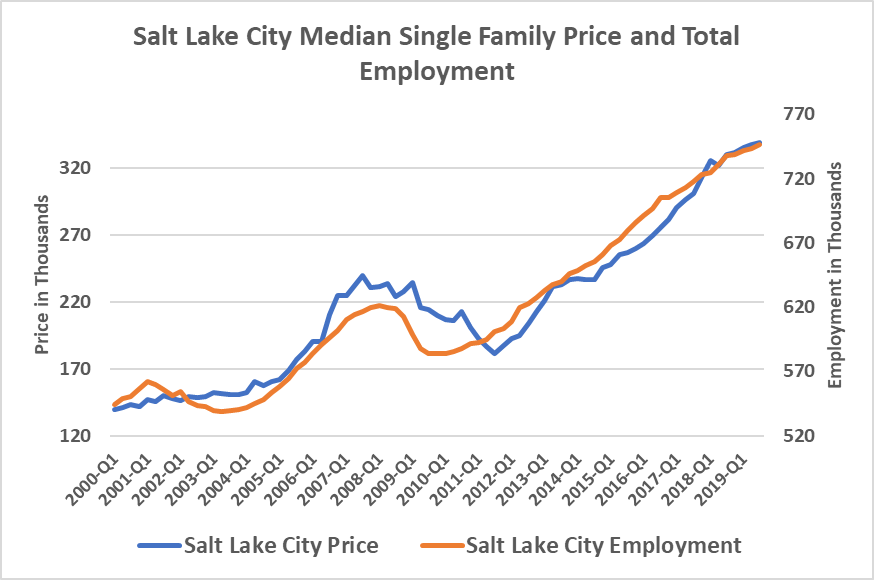
Next, we show the larger CBSA markets, with only 18 local markets shown below in Exhibit 2. Here we observe a similar but even stronger relationship of prices to employment, with a 1.56 coefficient for the change in price relative to the change in employment. The linear trend line is included. The highest change in prices is Los Angeles at 234% over this time period, with 12.77% change in employment. This period includes the rapid run up in prices in those markets like Phoenix, Jacksonville, Portland and Seattle where subprime lending expanded in the 2000-2006 period leading to faster price appreciation and subsequent declines. These relationships are shown in the appendix.
A recent study by the Hoyt Advisory Services for the National Apartment Association attempted to generate an index comparing many major CBSAs and this index, which combines land availability along with process complexity for entitlement, time for approvals, density and growth restrictions, community involvement in the process and cost for approvals, was added to the analysis in a single variable called supply barriers.[2]
Exhibit 2: Major CBSA Single-Family Price Change Versus Employment 2000-2019
Regressing single family home price changes against both employment and supply barriers for the 20-year time period of 2000-2019 using a simple linear model results in the following, with an adjusted R squared of .37. Note that both the employment change and the supply barrier measures are both significant, but the dominant driver here of price change is the change in employment. When tested on a local level in our past research, those markets with higher supply barriers like San Francisco tend to show a greater price response to changes in employment.[3]
| Regression Statistics | |||||
| Multiple R | 0.668260633 | ||||
| R Square | 0.446572274 | ||||
| Adjusted R Square | 0.37278191 | ||||
| Standard Error | 38.8975133 | ||||
| Observations | 18 | ||||
| df | SS | MS | F | Significance F | |
| Regression | 2 | 18313.26 | 9156.6 | 6.0519 | 0.01182924 |
| Residual | 15 | 22695.25 | 1513.0 | ||
| Total | 17 | 41008.51 | |||
| Coefficients | Standard Error | t Stat | P-value | ||
| Intercept | -30.97746848 | 51.9545 | -0.5962 | 0.5599 | |
| Emp Chg | 1.575682934 | 0.597763 | 2.6359 | 0.0187 | |
| Sup Barrier | 105.361944 | 45.87179 | 2.2968 | 0.0364 | |
Overall, we can conclude that employment changes are a critical driver of housing demand and well correlated with changes in home prices, especially when viewed over the long run.
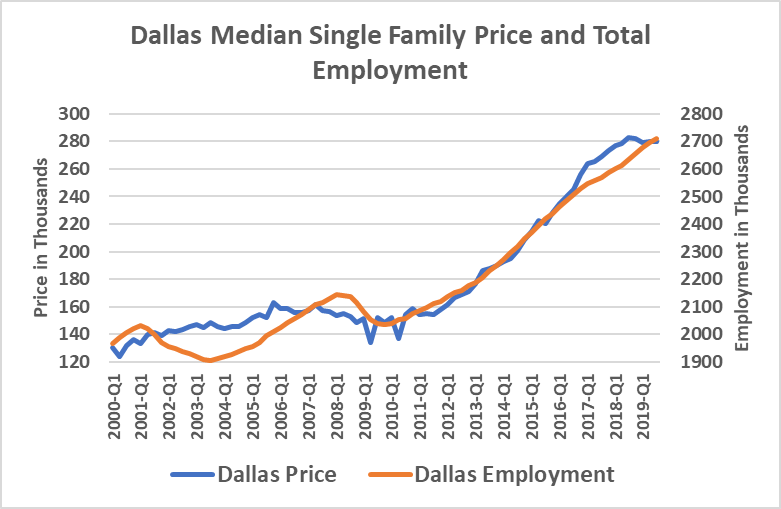
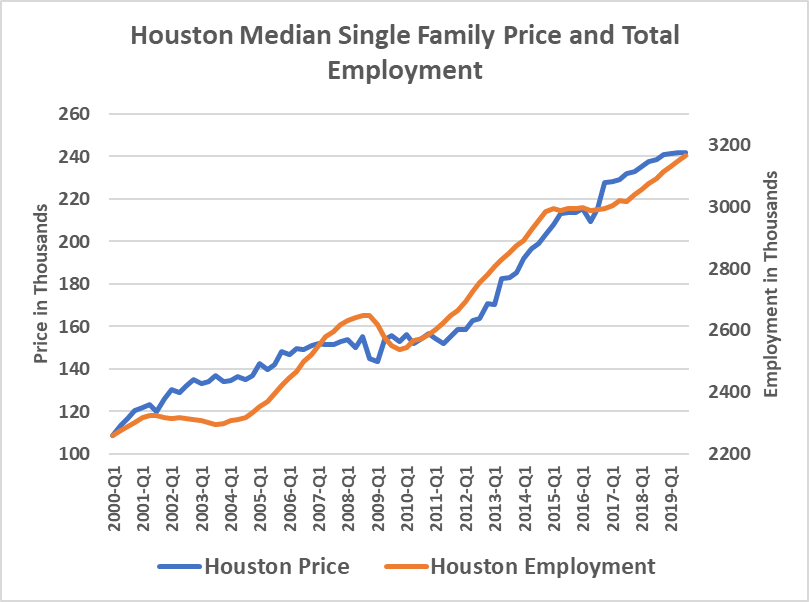
With this in mind, homebuyers and investors may want to pay particular attention to a number of CBSAs which our forecast models predict to have the highest projected employment growth rates for the next five years such as Austin, Dallas, Orlando, Houston, Raleigh, and Seattle.
Conclusions
We understand that there are many factors which drive home prices and here we focused primarily on one important measure, employment. Employment provides an excellent long-term indicator of demand, even without including variables for changes in interest rates, population changes or access to credit, all indicators that are more important for short term forecasts of housing prices. Positive employment change is essential for any kind of local income growth including the retention of local population. Adding in an index that measures supply barriers and variables for interest rate changes would improve the forecasts as we have demonstrated in more robust analysis in our prior research. Here, we simply wanted to demonstrate the strong long-term relationship of housing prices with employment holds for most housing markets.
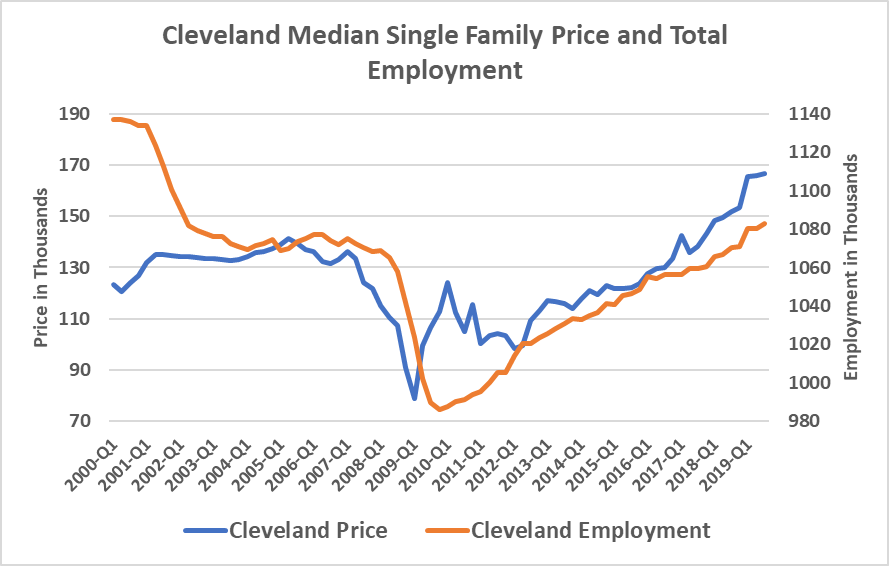
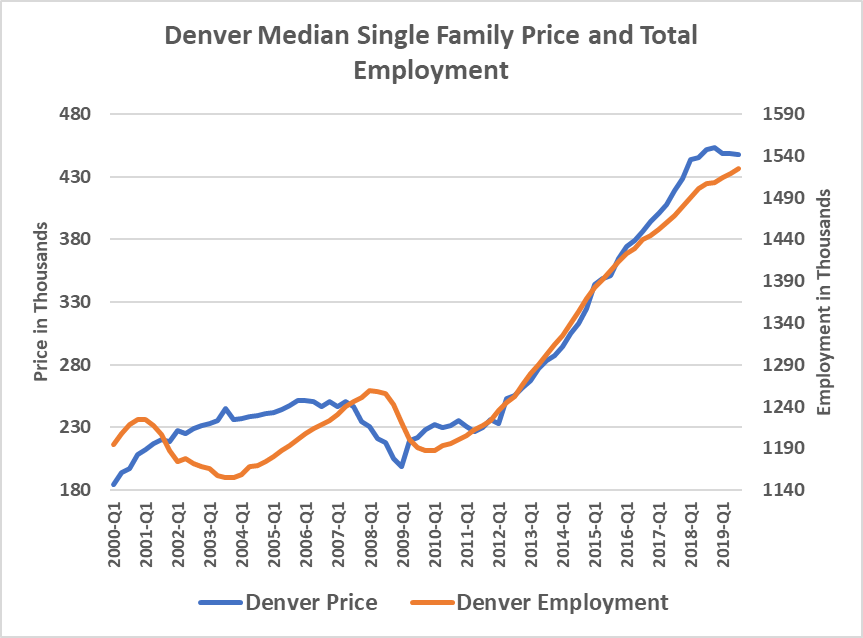
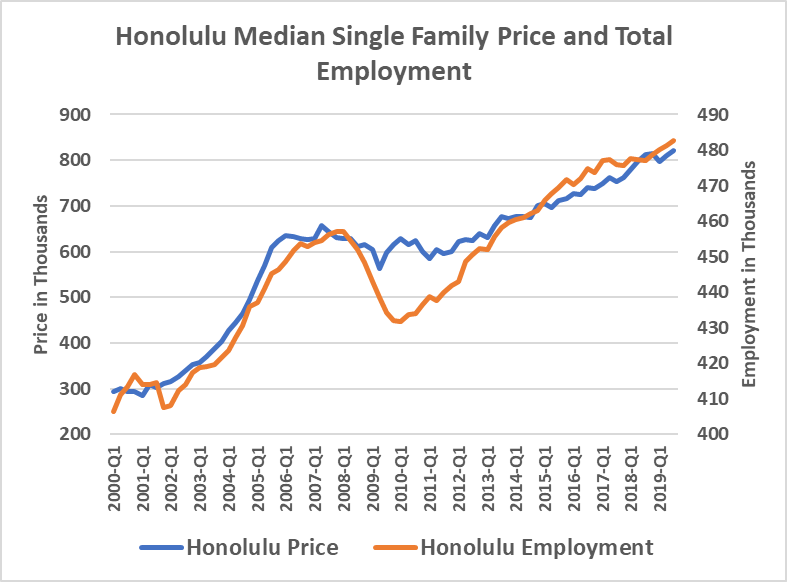
Appendix: Additional Charts Comparing Employment to Single Family Price Change by Market
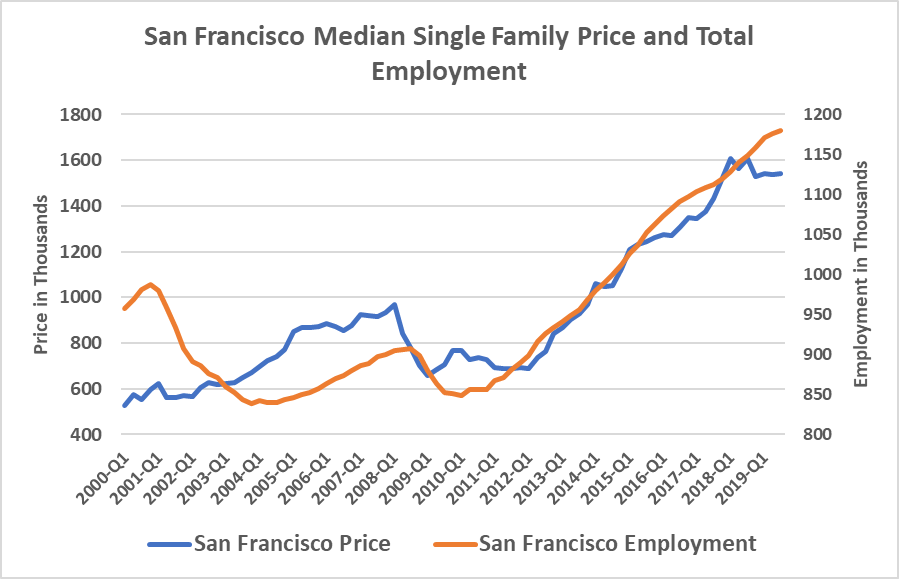
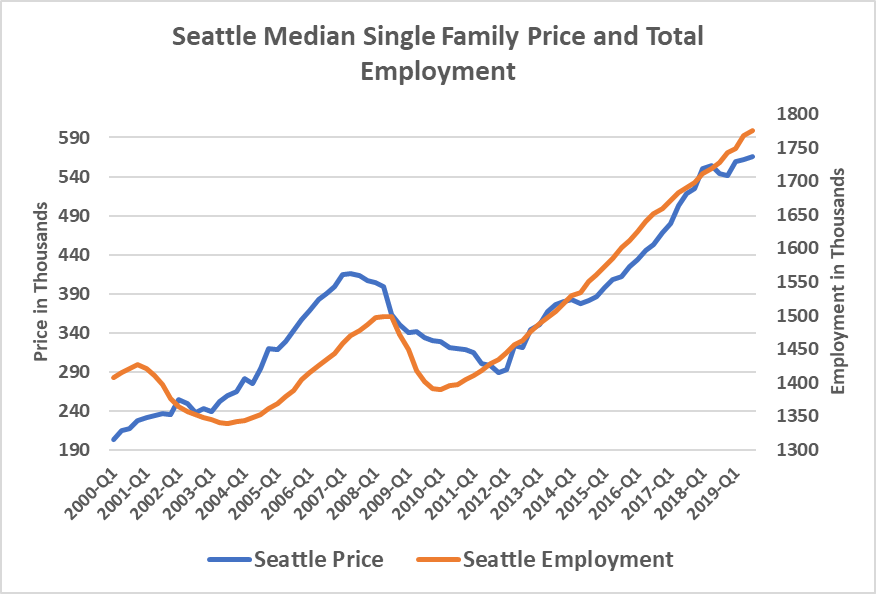
Among other factors, supply barriers will drive up prices faster the more difficult it is to add new supply. In the appendix, we show two supply constrained markets, San Francisco and Honolulu. San Francisco, like many other markets saw faster price increases during the easier credit access period of 2000-2006 even when employment was declining, but since 2009 has shown a highly correlated relationship. This easy credit period of the early to mid-2000’s is likely why the stronger relationship is apparent over the 2010-2019 time period for several markets, and why some markets like Phoenix, where subprime lending was more prevalent, show faster price increases and subsequent declines in the 2004-2009 period. Credit access and subprime demand was very strong in markets like Phoenix in the early 2000-2006 time period with the resulting faster price increases early on followed by larger price dips when foreclosure rates accelerated. Seattle also was more affected by the housing subprime access, but the strong economy has since pushed prices up. Employment as an indicator of demand appears very critical in all markets.
A sample of metro markets are shown below for the period of 2000-2019.
CA RESEARCH – A Longer-Term Look at Housing Prices Versus Employment 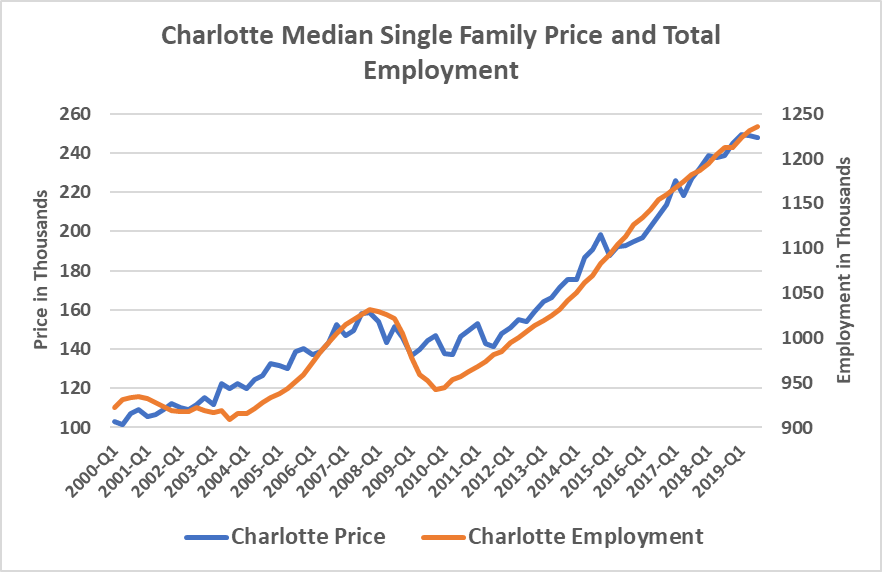

Footnotes
[1] Here only total employment changes are considered.
[2] See https://www.naahq.org/news-publications/barriers-apartment-construction-index
[3] See N. Miller and M. Sklarz “Integrating Real Estate Market Based Indicators into Fundamental Home Price Forecasting Systems” Journal of Housing Research, Vol. 21, No. 2, pp.183-215, 2012. Also N. Miller, L. Peng and M. Sklarz, “House Prices and Economic Growth”, Journal of Real Estate Finance and Economics, Vol. 42, No. 4, 2011, pp 522-541, and “The Impact of Interest Rates and Employment on Housing Prices” with Michael Sklarz and Tom Thibodeau International Real Estate Review, Vol.8, No. 1: pp 26-42. 2005