by Michael Sklarz, Ph.D., Jim Follain Ph.D., and Norm Miller Ph.D.
It seems that everyone has an opinion regarding the state of the real estate market. Most of these opinions are anecdotal and subjective which is unfortunate given the importance of the real estate market to the larger economy. On the most basic level, these opinions take the form of a “Buyer’s Market” or a “Seller’s Market” which are both far too simplistic and typically misleading.
Collateral Analytics has taken a different approach to this and has created a purely objective way to define the condition of the real estate market. This Market Condition Ranking uses a number of individual and well-known market indicators which CA has been using for many years to predict the future direction of home prices. In fact, these include the same market indicators which appraisers are asked to use to complete the Market Condition Addendum in the standard 1004 Appraisal.
These series are the values and trends over the past 12 months for:
- Number of Sales
- Absorption Rate
- Number of Active Listings
- Months of Inventory Remaining
- Median Sold Price
- Median Sold Market Time
- Median Active Listing Price
- Median Listing Active Market Time
- Median Sold-To-List Price Ratio
- Number of Foreclosure Sales as a Percentage of Regular and REO Sales
We combine the magnitudes and trends of these 10 indicators into a qualitative market ranking which ranges from Distressed to Hot as seen below.
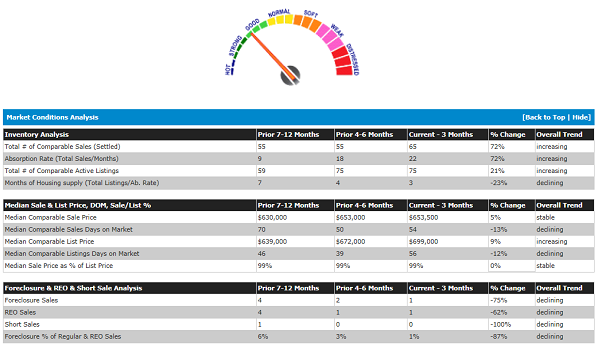 Figure 1
The powerful thing about this ranking system is that it can be completely automated and can be used to define current or historical market conditions on any geographical level (e.g. state, CBSA, county, city, ZIP Code, or neighborhood), property type, property characteristics, or price range. Figure 2 below shows quarterly values of this Market Condition Ranking for single family homes in Maricopa County AZ back to 2005. Note how the market condition went from Strong in late 2005 to Distressed in early 2008 and then quickly recovered to Normal in mid-2009 before surging to Strong again in mid-2012. The market has cooled off since then and currently is showing a Good ranking. In addition, as seen in Figure 3, notice how the Market Condition Ranking did a very good job predicting the future direction of home prices on both the downside and upside of the cycle.
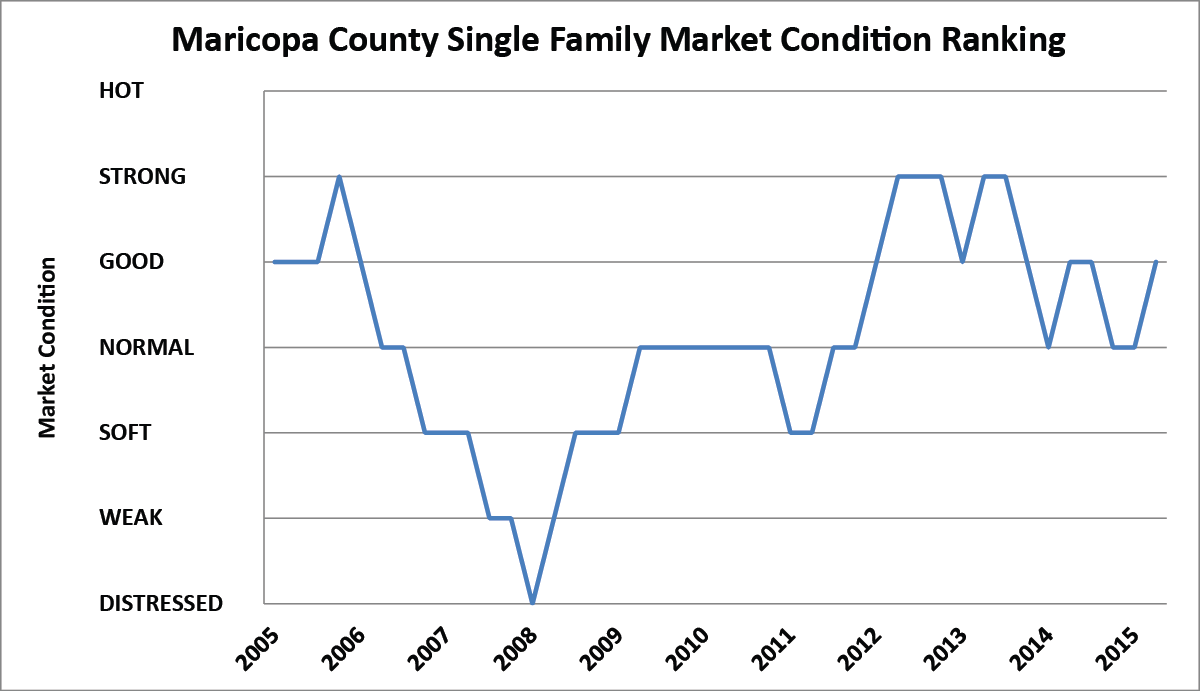
Figure 2
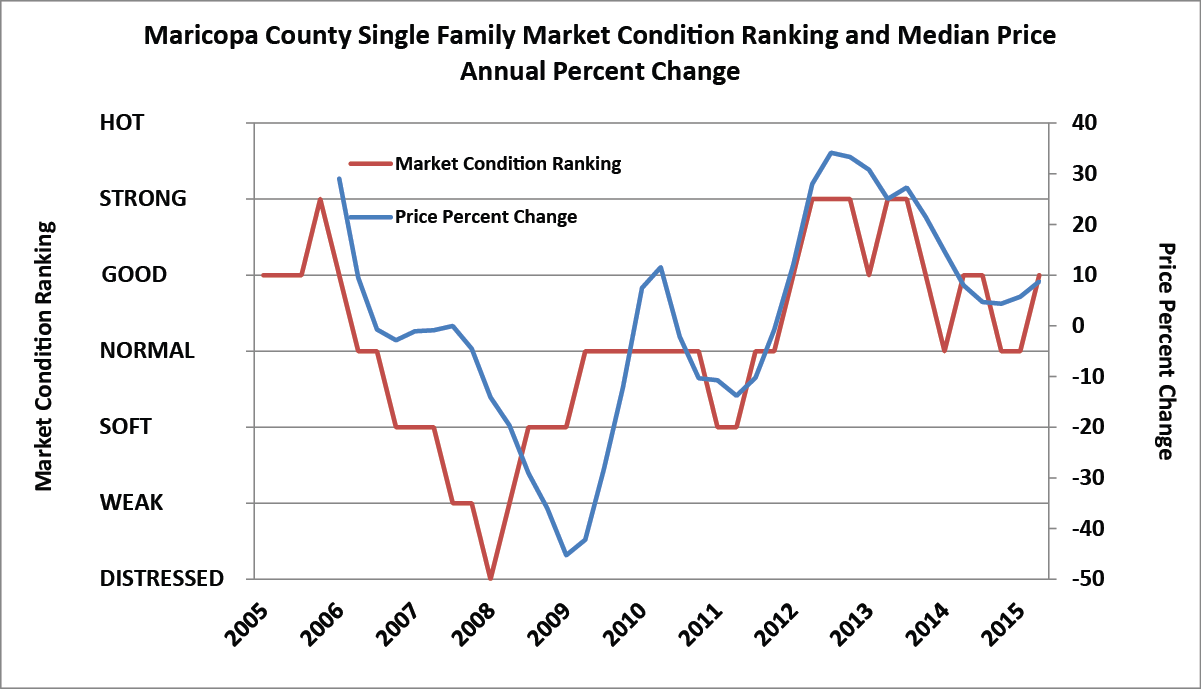
Figure 3
The Bay Area, in General, and San Francisco, in particular, have been particularly interesting markets in the past several years. Figure 4 shows the Collateral Analytics Market Condition Ranking for San Francisco County. As seen, this market never reached the Distressed condition which many other markets did in the 2008-2009 period. In addition, this market reached a Hot level in late 2012 and has been fluctuating between this level and Strong since that time.
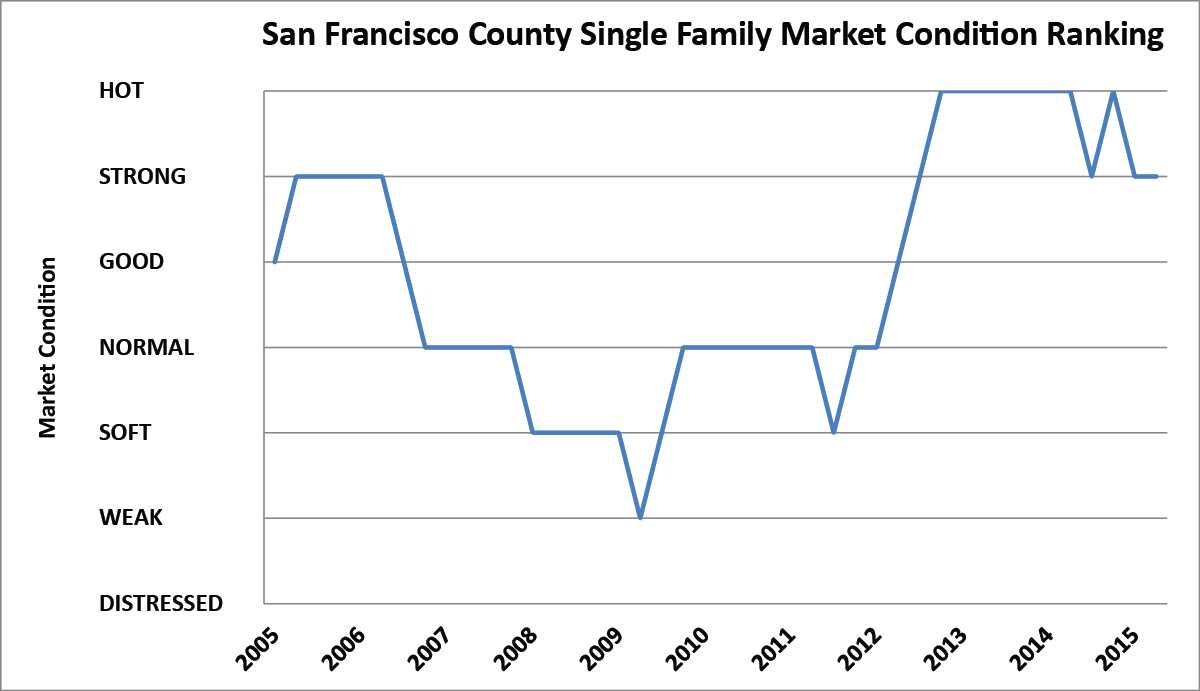
Figure 4
Our focus at Collateral Analytics is to analyze and track real estate markets in a very local way. Thus, we do not feel that it makes sense to discuss the nationwide market with regard to prices or market condition. However, if one insists on doing so, our Market Condition Ranking provides a way to do so. Figure 5 shows the composite value of the individual market rankings for approximately 300 of the largest counties in terms of sales activity. As seen, the current condition of the overall market is between Normal and Good.
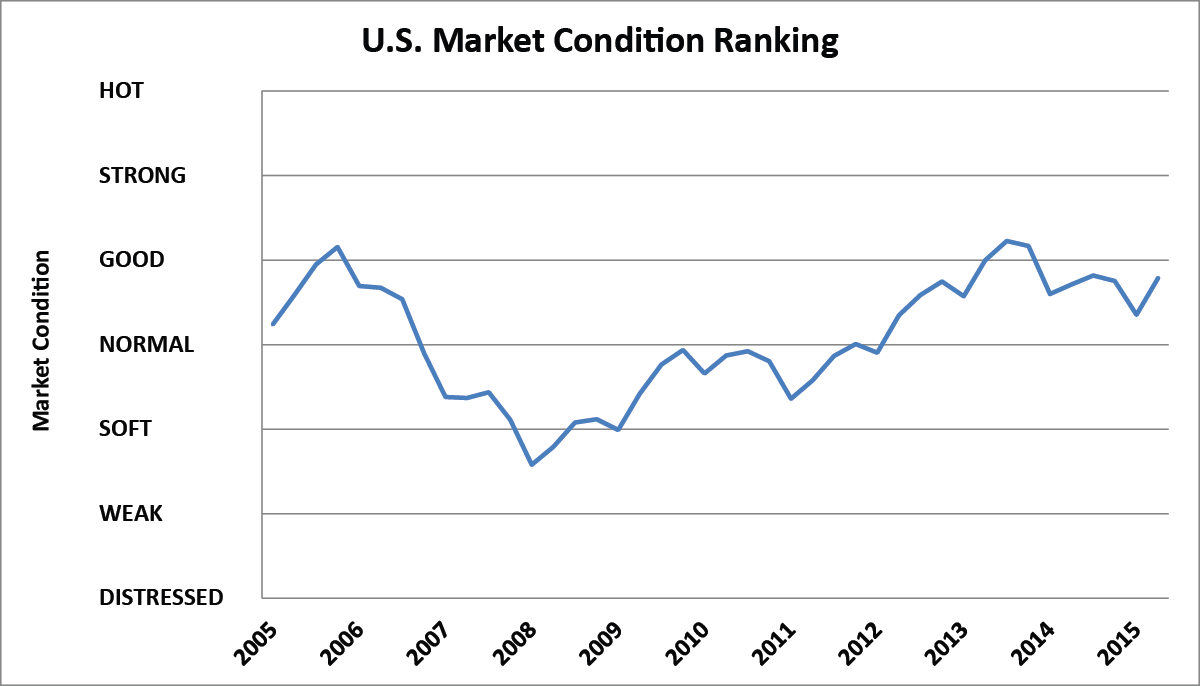
Figure 5
Finally, the Collateral Analytics Market Condition Rankings provide an excellent way to view the geographic dispersion of conditions in individual markets. Figure 6 below shows a thematic map of San Diego County ZIP Codes where different colors correspond to the various market conditions. These maps are particularly interesting to observe over time and see how the market conditions change from one area to another.
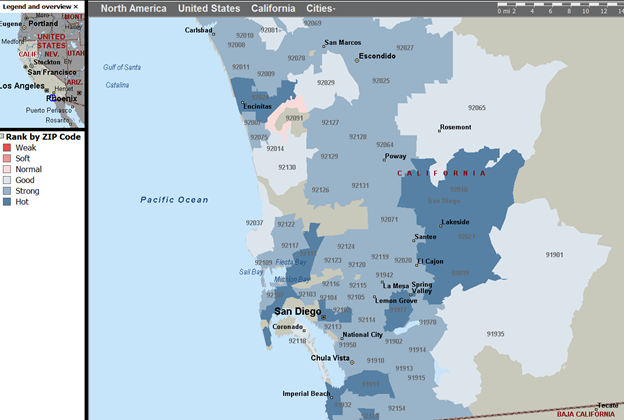
Figure 6
Download a PDF file of this research paper here.