by Dr. Michael Sklarz and Dr. Norman Miller | September 20, 2018
Download a PDF file of this research paper here.
Introduction
Aside from school quality and view, noise is among the most significant locational factors affecting the value of residential property. Noise affects humans in many negative ways. Excessive noise is blamed for health problems induced by sleep disturbance. Noise negatively affects the cognitive function of school aged children, indices physiological stress reactions, cardiovascular disease, and other psychiatric disorders, all of which hurt productivity.[1] Studies have shown that people exposed to high levels of traffic noise, with a 24‐ hour average of 55 decibels or more, are at a higher risk for hypertension as well, (Barregard, Bonde, and Ohrström, 2009; Bodin et al., 2009), and those exposed to 60 decibels or more are a higher risk for stroke (Sørensen et al., 2011).[2] If humans are affected by noise, so must be the value of residential property value.
The question addressed here is whether noise measurements and the integration of a noise variable would improve the valuation of residential property. Just like many other factors that could influence value, such as views or property condition, it is possible to pick up proxies for these effects by carefully controlling for the location of observations used to feed a valuation model. Here we include data from airport noise and highway noise, certainly not a complete set of all the generators of noise but a reasonable exploration of this question.
Background
Most studies of residential property value focused on the impact of a particular feature or attribute, have used hedonic pricing models that attempt to control for the majority of the influences on value and then isolate the variable of interest. One of the earlier studies that included the impact of noise is by Zietz (2005) focused on proximity to an airport. The authors did not find any meaningful correlation between airport noise and the selling price of a house,[3] but including such a variable in their model supposedly encouraged other studies to do so as well.[4] It could have been that locational controls mitigated the separation of noise and in fact, if the airport is centrally located, close to the city, we may observe high centrally located land values
offsetting the negative influence of noise. Think of Reagan Airport in Washington D.C., Midway in Chicago, or San Diego’s centrally located airport minutes from the central business district as examples.
In 2011, Joan Blanco and Ian Flindell of Southampton University in the United Kingdom published an article whose title, “Property prices in urban areas affected by road traffic noise”, effectively illustrated their hypothesis. Seeking to identify the monetary costs of road traffic noise, the authors applied a hedonic price method to compare three residential areas in different parts of the United Kingdom for different types of property in each area.[5]
Analyzing the center of London, the center of Birmingham, and the center in Sutton Coldfield, their results suggest that in the presence of choice between different properties with similar facilities but with different outdoor sound levels, people were sensitive to road traffic noise and accordingly paid more or less for a particular location.[6]
Similar to Blanco and Flindell, Sebastian Brandt and Wolfgang Maennig published a 2011 study on the impact of road noise exposure on residential property prices in Hamburg, Germany using a hedonic regression model. Unique to their study at the time it was published however, is that it was the first of its kind to examine the influence of mixed traffic pollution, including road, air, and rail traffic, on housing prices. The authors conclude from their results that price discounts depend on the noise level, but that these [discounts] are significantly lower for low levels of road noise as well as significantly higher for high noise levels, suggesting non-linearity. They also conclude that to obtain adequate coefficients for the impact of road noise, it is necessary to control for variables that might be correlated with road noise like air pollution.[7]
In their 2013 study, “Hedonic Estimates of Rail Noise in Seoul”, authors Justin Chang and Dae-Jin Kim used a hedonic pricing model to estimate the impact of urban rail noise on housing prices in Seoul, South Korea. Using a semi-log form and extensive trial-and-error experimentation, the model also considered trade-offs between housing prices, locality, and environment intrusion. Based on the data, they found that property values in the Seoul area decreased by 0.53% for every unit increase in decibel.
In 2015, Szczepanska, Senetra, and Wasilewicz-Pszczółkowska conducted a similar study in Olsztyn, Poland. Aptly titled “The effect of road traffic noise on the prices of residential property – A case study of the polish city of Olsztyn”, the study utilized acoustic maps of Olsztyn and Noise Depreciation Sensitivity Index values to analyze the relationship between noise and house prices. The analysis utilized two different sample locations, one that was heavily exposed to road traffic and another that was far from sources of road traffic noise. Together, these two samples were representative of the entire city. Linear correlations between unit prices of apartments and noise levels were analyzed, with the results of their study again confirming that noise pollution is an important determinant of real estate prices. For example, the lowest prices in the city were associated with houses that were in immediate proximity to the national transit road.
In another 2015 study, authors Swoboda, Nega and Timm explored the impact of noise on single family housing transactions in St. Paul, Minnesota from 2005 to 2010. The authors used a semi-logarithmic regression model which analyzed a variety of structural and locational variables related to housing, such as size, lot size, architectural style, and distances to amenities against the noise data from a house’s location.[8] The authors “first created a traffic noise exposure surface by calculating the propagation of traffic noise over the landscape using the Federal Highway Authority (FHWA) 1978 standard. The authors contributed to the methodology on modeling of traffic noise by using precise spatial models. Due to the high spatial resolution of the estimates, with such detail as nearby buildings and vegetation land cover, the authors believed their noise data to be the most accurate available estimates at the time the study was published.
The authors created their own measurements by using the Federal Highway Authority 1978 standard in conjunction with SoundPlanTM noise modeling software. They also incorporated noise produced by aircraft into the overall noise exposure from aircraft noise contour lines of the region that they obtained from the Twin Cities Metropolitan Airports Commission.[9] Even so, the authors admit that their “noise variable is also a model estimate, not a direct measurement of the noise levels encountered by potential house buyers when deciding on their willingness to pay for the property.”
Different than all previous studies of noise pollution on housing prices that focused on one noise source, Wolfgang Maennig and Waldemar Beimar’s 2017 study simultaneously analyzed the effects of different noise sources, specifically both the individual and combined impacts of road, air traffic, and train noise, on housing prices. The authors aimed to close the gap between different noise sources and isolate the potentially different effects of alternative noise sources, namely road, air, and train, on housing prices.[10] From this study, the authors found that flight noise had the most negative effect on housing prices, and road and train noises had similar but smaller effects.[11] It could be that when high levels of intermittent noise are worse than high levels of steady noise which humans can sometimes filter out as white noise, if not too severe.
Noise Data Described
The Bureau of Transportation Statistics publishes the National Transportation noise data, some generated from the Department of Transportation and others from the Federal Aviation Administration.[12] To give an idea of how decibels translate to noise levels, consider the following comparable sounds.
| Noise in Decibels | Comparable Noise |
| Less than 30 | Quiet |
| 40 to 50 | Quiet office with some activity |
| 50 to 59 | Conversation in restaurant |
| 60 to 69 | Dishwasher |
| 70 to 79 | Vacuum cleaner |
| 80 plus | Garbage disposal or Aircraft |
A Case Study: San Diego
Noise data was collected based on decibels generated from two sources, road sources and the airport flight paths for San Diego County and geocoded by latitude and longitude. These two sources of noise data were merged for the entire San Diego metro market that happens to match with the San Diego county.
Measurements are based on sources that were averages for recent years, 2016 and 2017. In Exhibit 1 we show the general relationship between median home prices and noise levels, noting that higher noise generally implies lower values. However, the variance at higher noise levels reflects the high valued urban land where noise is high but land value is also high.
Exhibit 1: Noise and Home Prices
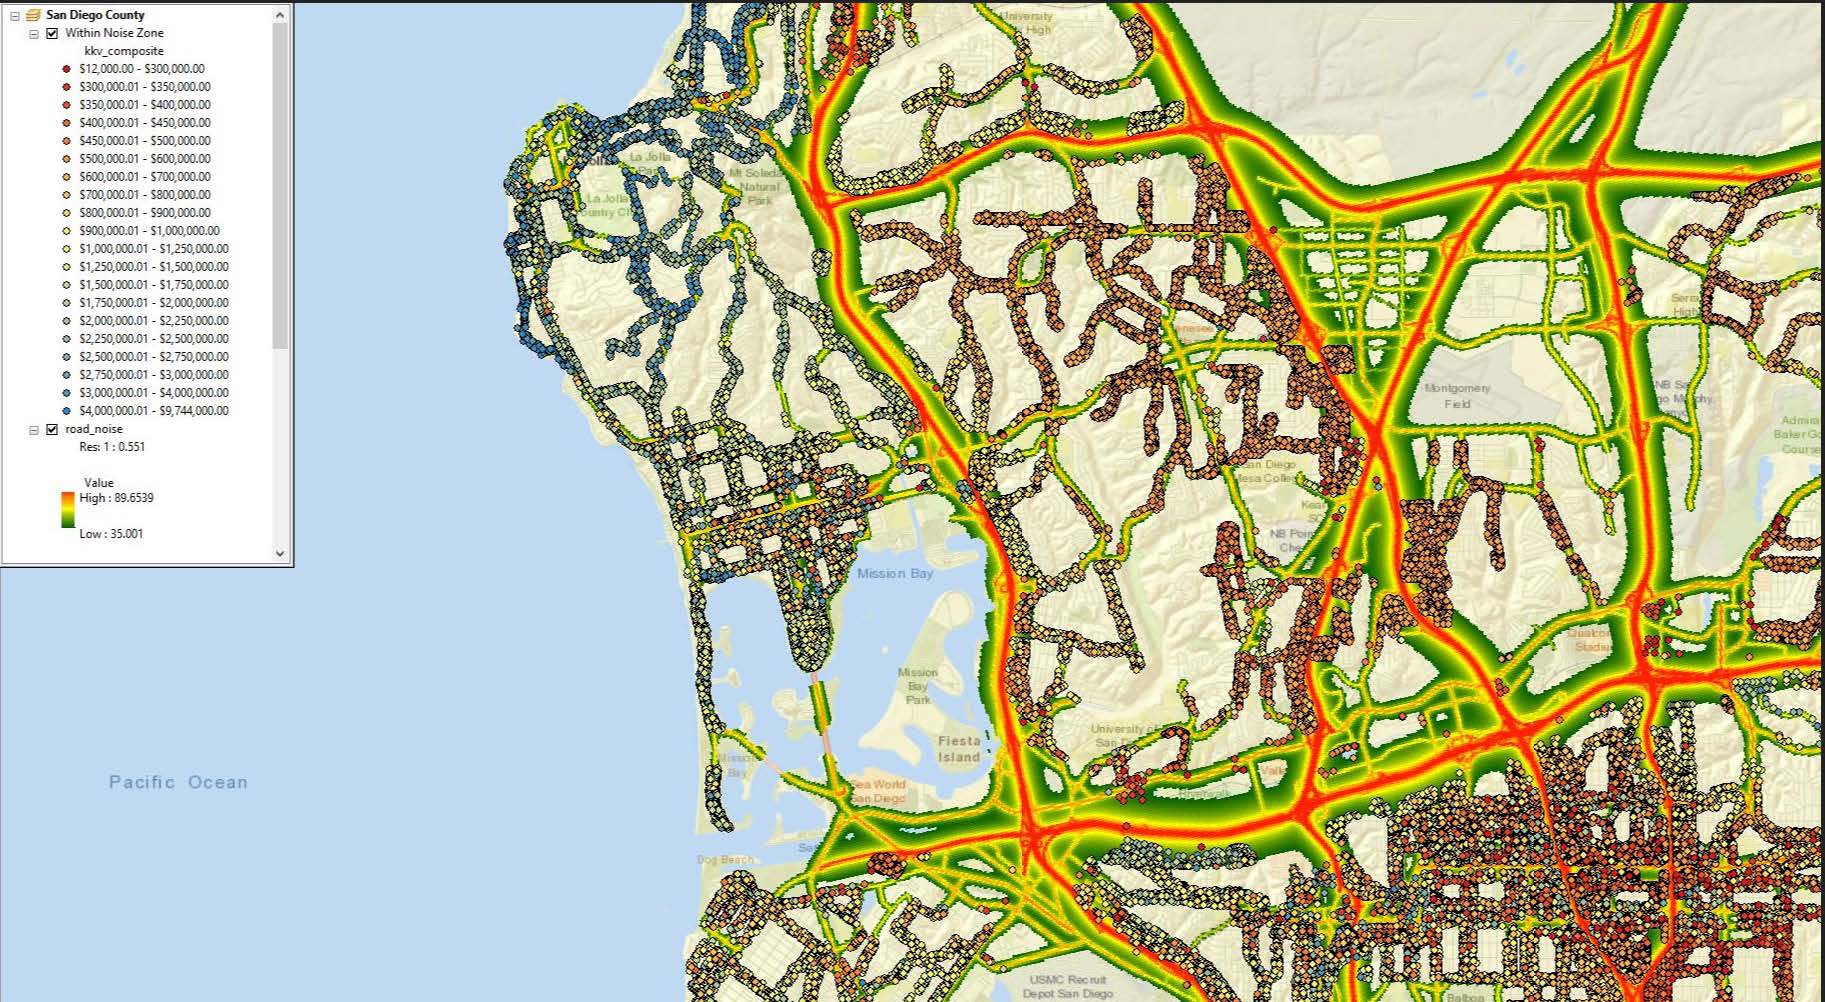
A map is shown below for part of this data, with darker red indicating greater noise levels, in Exhibit 2. Noise is heaviest along major highways and also the flight path into the airport. We used such data for the entire county to analyze the impact of noise on home values.
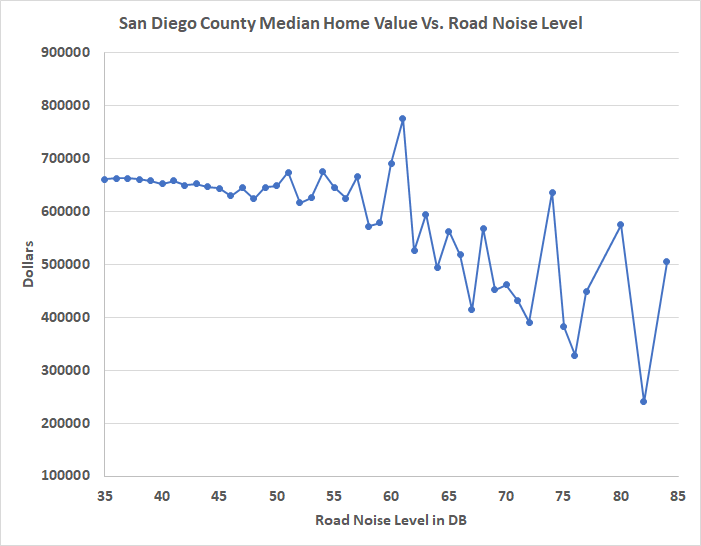
Exhibit 2: Road Noise Map for Central San Diego Source: Collateral Analytics

In Exhibit 3 below, we add in the average home prices where blue is higher and red is lower. The scale to the left of the image may not be readable without enlarging, but one can observe the deeper red colors nearest the highways.
Exhibit 3: Road Noise Map for Central San Diego with Average Home Prices Source: Collateral Analytics
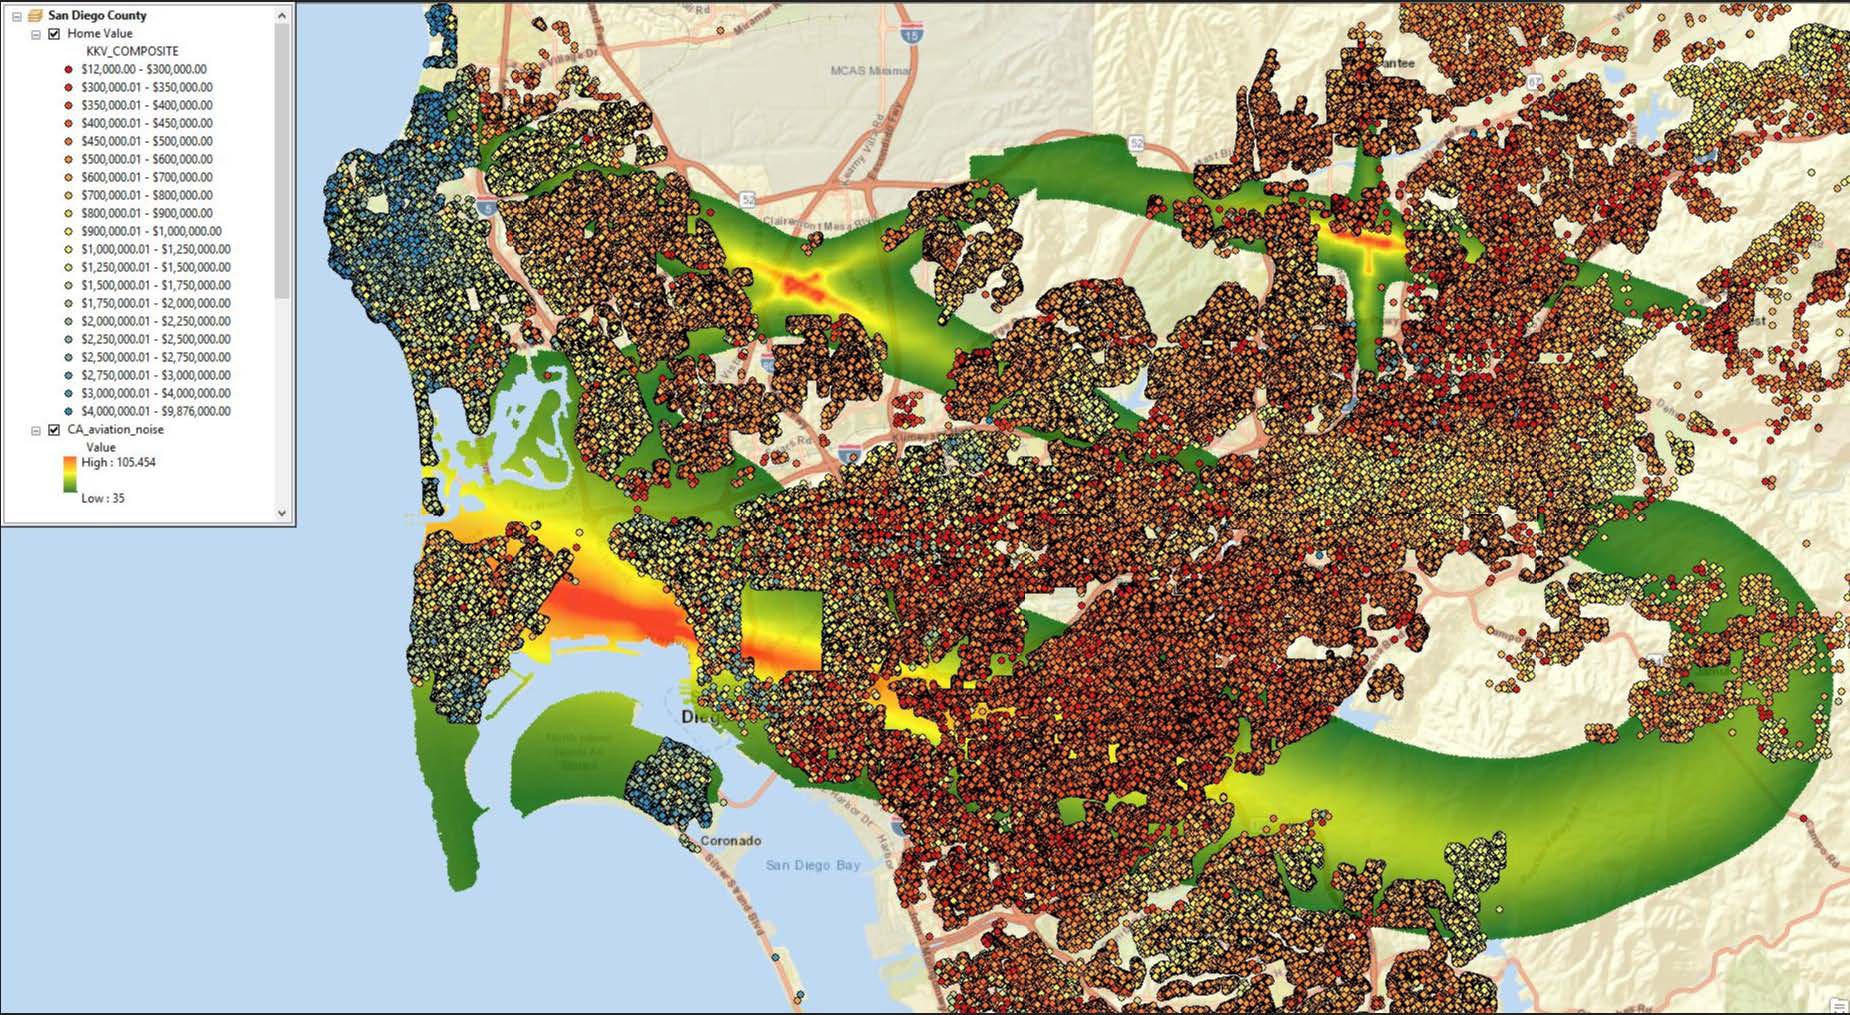
Below in Exhibit 4 we combined the air flight noise with the road noise and also the average home prices. While this requires enlargement to see detail, it does provide the expected relationship where we observe a wide path of lower values under the flight path. The swath of orange with yellow fringe is the flight path out of the airport and to the east we observe the landing path. The scale of the road noise is now lower as a result of the higher decibel air flight noise.
Exhibit 4: Road and Air Flight Noise Map for Central San Diego with Average Home Prices
Source: Collateral Analytics
While the visual maps depict very general relationships, the are a number of other factors that significantly influence values. To capture many of these other influences from physical size, age, features and location amenities, we used a separate fairly simple valuation model. The challenge of this type of analysis is that location controls will include the impact of noise and only a similar location with similar homes could provide a definitive separation of the noise impact. Here we will not be able to have a perfect paired comparison., but rather a general analysis of potential marginal effects from noise on property value.
Data considered: Both road noise and aviation noise is included in the initial test, using the highest of the two measures. For this initial test of the effect of noise, measured in decibels, (Db), 73,958 transactions based on resales of existing homes that were sold in the last few years were run with the following model:
Dependent Variable = Log natural, Ln, of the automated valuation model estimate of selling price.
Independent variables in log form included living area in square feet, lot size, bedrooms, baths, age in years, noise in Db, and a constant. Noise levels were grouped to allow for the possibility of non-linearity. Aside from the control model, the following results were found on noise groups:
R Squared = .78 with a control model that included living area, lot area, age, bedrooms, baths, and a constant.
| Noise Level | Regression Coefficient |
| Noise 40-50 Dbs | -.00204 |
| Noise 50-59 Dbs | -.00508 |
| Noise 60Dbs + | .00908 |
These regression coefficients were all modestly significant at the 10% level except for the one above 60Dbs, where the significance was low and unreliable. With respect to the break down by noise level we provide the following: .93 of 1 % of the observations had noise levels above 60Dbs, while 5.8% were in the 50 to 60 Db range and over 80% were in the 40 to 50 Db range. The results found on the highest noise levels are positive but the location of these properties tend to be near the downtown, so a location control should enable teasing out the positive effect of the central location. Still, the conclusion is that noise matters, and while hard to measure, will likely exert a non-linear effect on property values.
Conclusions
We know noise matters and the effects are likely to be non-linear based on prior studies. We also know that design and construction might be used to partially mitigate the effects of noise. For example, triple insulated windows will bring noise levels down considerably and are frequently observed on buildings near airports.
In this and other studies where we do not find significant impacts from noise at the highest decibel levels, the location is also very central and thus highly valuable land. This makes it harder to separate out the over lapping negatives from noise and the positives from a central urban location. With better location controls, we will see that noise is a very significant factor influencing the values of any given site and property.
References
Barregard, L, E Bonde, E Ohrström, 2009, “Risk of Hypertension from Exposure to Road Traffic Noise in a Population-Based Sample.” Occupational and Environmental Medicine 66(6): 410-415
Beimer, Waldemar, Wolfgang Maennig, 2017, “Noise Effects and Real Estate Prices: A Simultaneous Analysis of Different Noise Sources.” Transportation Research Part D 54: 282-286
Blanco, Joan C, Ian Flindell, 2011, “Property Prices in Urban Areas Affected by Road Traffic Noise.” Applied Acoustics 72: 133-141
Bodin, Theo, Maria Albin, Jonas Ardö, Emilie Stroh, Per-Olof Östergren, Jonas Björk, 2009, “Road Traffic Noise and Hypertension: Results From a Cross-Sectional Public Health Survey in Southern Sweden.” Environmental Health 8(38)
Brandt, Sebastian, Wolfgang Maennig, 2011, “Road Noise Exposure and Residential Property Prices: Evidence from Hamburg.” Transportation Research Part D 16: 23-30
Sirmans, G. Stacy, David A. Macpherson, Emily N. Zietz, 2005, “The Composition of Hedonic Pricing Models.” American Real Estate Society 13 (1): 3-43
Sørensen M, M Hvidberg, ZJ Andersen, RB Nordsborg, KG Lillelund, J Jakobsen, 2011 “Road Traffic Noise and Stroke: A Prospective Cohort Study.” European Heart Journal 32: 737–744.
Swoboda, Aaron, Tsegaye Nega, Maxwell Timm, 2015, “Hedonic Analysis Over Time and Space: The Case of House Prices and Traffic Noise.” Journal of Regional Science 55: 644-670
Szczepanska, Agnieska, Adam Senetra, Monika Wasilewicz-Pszczólkowska, 2015, “The Effect of Road Traffic Noise on the Prices of Residential Property – A Case Study of the Polish City of Olsztyn.” Transportation Research Part D 36: 167-177
Footnotes
[1] A. Szczepan ́ska et al. / Transportation Research Part D 36 (2015) 167–177
[2] See this and other studies reviewed in Swoboda, A. , Nega, T. and Timm, M. (2015), HEDONIC ANALYSIS OVER TIME AND SPACE: THE CASE OF HOUSE PRICES AND TRAFFIC NOISE. Journal of Regional Science, 55: 644-670.
[3] W. Beimer, W. Maennig / Transportation Research Part D 54 (2017) 282–286
[4] Sirmans, G.S., Macpherson, D.A., Zietz, E.N., 2005. The composition of hedonic pricing models. J. Real Estate Literat. 13 (1), 3.
[5] J.C. Blanco, I. Flindell / Applied Acoustics 72 (2011) 133-141, 134
[6] Id.
[7] S. Brandt, W. Maennig / Transportation Research Part D 16 (2011) 23–30
[8] Swoboda, A. , Nega, T. and Timm, M. (2015), HEDONIC ANALYSIS OVER TIME AND SPACE: THE CASE OF HOUSE PRICES AND TRAFFIC Journal of Regional Science, 55: 644-670.
[9] Swoboda, , Nega, T. and Timm, M. (2015), HEDONIC ANALYSIS OVER TIME AND SPACE: THE CASE OF HOUSE PRICES AND TRAFFIC NOISE. Journal of Regional Science, 55: 644-670.
[10] Beimer, W Maennig / Transportation Research Part D 54 (2017) 282-286
[11] Beimer, W Maennig / Transportation Research Part D 54 (2017) 282-286
[12] See https://www.transportation.gov/highlights/national-transportation-noise-map